Evidentiary Compliance Overview
Evidentiary compliance tracking in Axon Performance allows administrators to monitor and measure the categorization and identification (ID) rates for various types of evidence beyond Body worn camera (BWC) and Fleet footage. This feature provides insight into compliance across video, audio, document, image, and zip files, supporting accountability and adherence to evidence management standards.
Understand evidentiary compliance metrics
Categorization rate
The categorization rate measures the percentage of evidence files that an officer has categorized out of the total files for the selected sources. This metric ensures that evidence is properly organized within a set time frame.
When enabled, you can define the following settings to tailor compliance tracking:
- Goal: Specify a compliance goal as a percentage, helping identify officers or squads who meet or fall short of the desired categorization level.
- Grace Period: Define the time limit (in days) within which evidence should be categorized for it to be counted as compliant.
ID rate
The ID rate measures the percentage of evidence files that contain an officer-added or confirmed ID relative to the total number of files for the selected sources. This metric tracks adherence to identification standards across evidence.
When enabled, you can define the following settings to tailor compliance tracking:
- Goal: Set a target percentage for the desired compliance level.
- Grace Period: Specify the time-frame (in days) within which an ID should be added or confirmed.
- Excluded Categories: Choose categories that should be excluded from the ID Rate calculation. Evidence files within these categories will not be factored into compliance results for the ID Rate metric.
Enable evidentiary compliance
- Sign into your Axon Evidence account.
- Select My Dashboard.
- Under Axon Performance, select Configure.
- Under Settings, select Performance metrics.
- Select the Other sources tab.
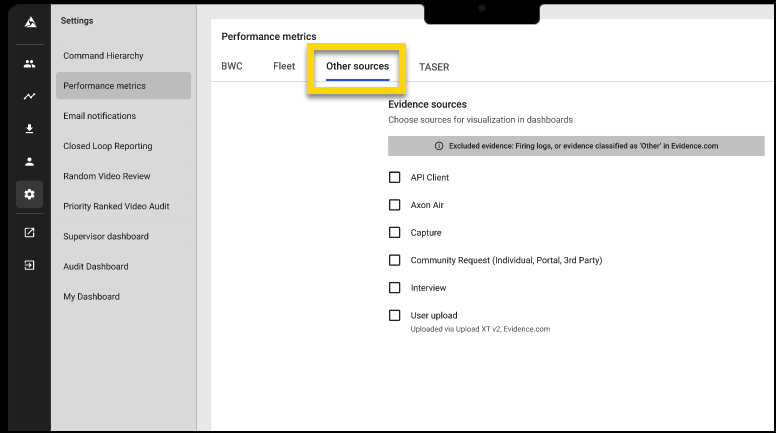
- Select one or more evidence sources to display their corresponding metrics on your dashboards. After you select at least one source, additional metrics visualization options will become available. Choose from the following sources:
- API Client: Evidence added through API integrations from external systems.
- Axon Air: Evidence collected via Axon's aerial drones and related devices.
- Capture: Evidence recorded directly from Axon Capture, the mobile app for gathering evidence.
- Community Request (Individual, Portal, 3rd Party): Evidence submitted by the public or third parties via online portals or direct requests.
- Interview: Evidence recorded from interview rooms equipped with Axon-supported recording systems.
- User Upload (Uploaded via Upload XT v2 or Axon Evidence): Evidence uploaded manually to Axon Evidence and through Upload XT v2, Axon’s tool for bulk uploading files. For more details on setting up and using Evidence Upload XT, see Get started with Evidence Upload XT..
- Enable one or both of the following metrics to display on your dashboards:
- Categorization Rate:
- Enter a Goal percentage to set the desired compliance level for categorization.
- Enter a Grace Period to define the number of days within evidence should be categorized.
- ID Rate:
- Enter a Goal percentage to set the desired compliance level for ID rates.
- Enter a Grace Period to define the number of days within IDs must be added or confirmed.
- Optionally, enter any Categories That Are Excluded From The Metric Calculation, so evidence in these categories will not impact the compliance rate.
- Categorization Rate:
- Select Save to apply your settings.
Where to view compliance metrics
The Categorization Rate and ID Rate metrics display across several dashboards in Axon Performance to support different levels of compliance tracking:
- Officer Page: View metrics for individual officers to monitor compliance on a per-officer basis. For more details, see the Officer Page Overview article.
- Squad Dashboard: View aggregated compliance metrics for all officers in a specific squad, helping supervisors track squad-wide adherence. For full guidance, see the Squad Dashboard Overview article.
- Management View: See agency-level compliance summaries, including top-performing and low-performing squads, with metrics for both Categorization Rate and ID Rate across selected evidence sources. For more information, refer to the Management View article
To learn more about monitoring out-of-compliance conditions or configuring device metrics, see the following articles:
- Identifying Out-of-Compliance Conditions: Guides on identifying officers or squads who do not meet compliance goals.
- Device Metrics Settings: Covers setup and configuration steps for evidentiary compliance metrics.
Frequently asked questions (FAQ)
Will untagged evidence emails include untagged evidence from other sources as well?
Yes, untagged evidence emails will include uncategorized evidence and evidence without an ID for all other sources enabled by your agency. When users select the hyperlinks in the email, they will be directed to Axon Evidence with the correct filters (e.g., date/time, user, source) already applied, allowing them to categorize and identify their evidence efficiently.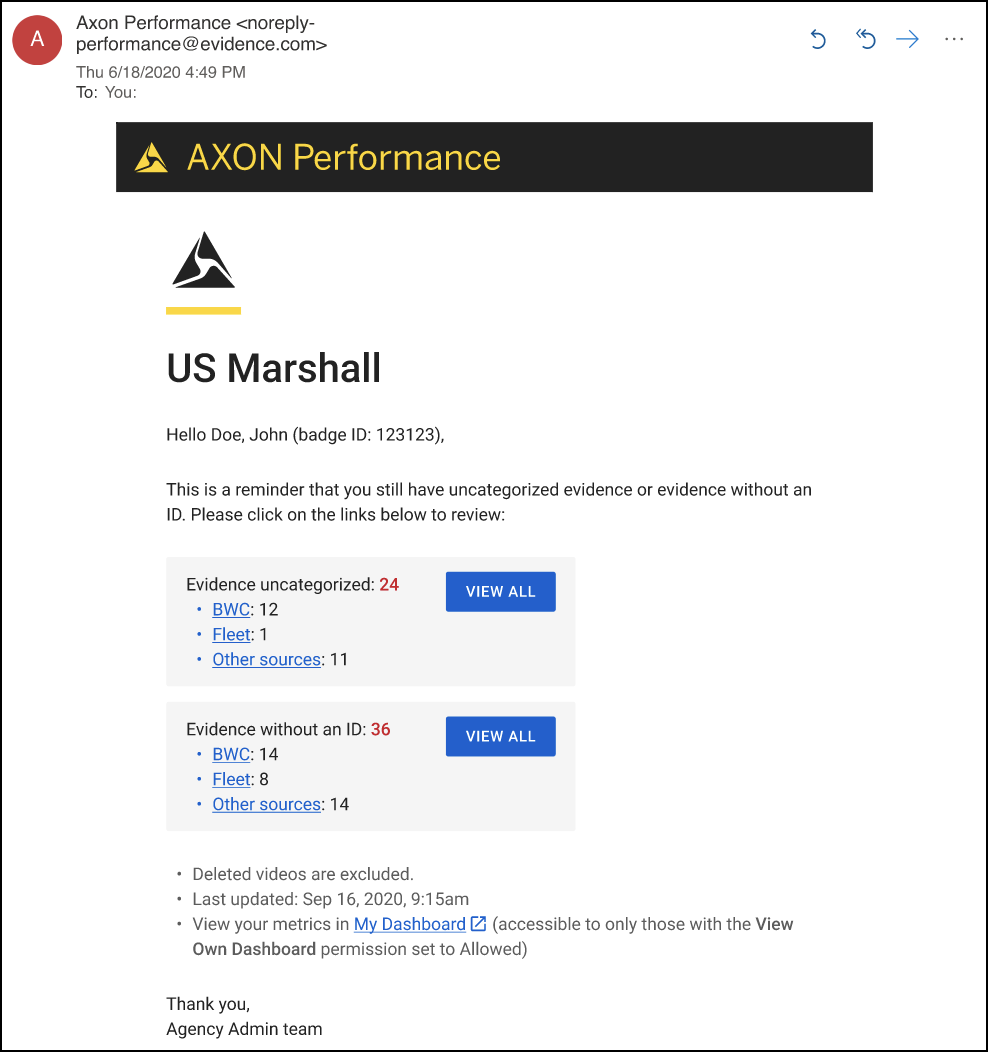
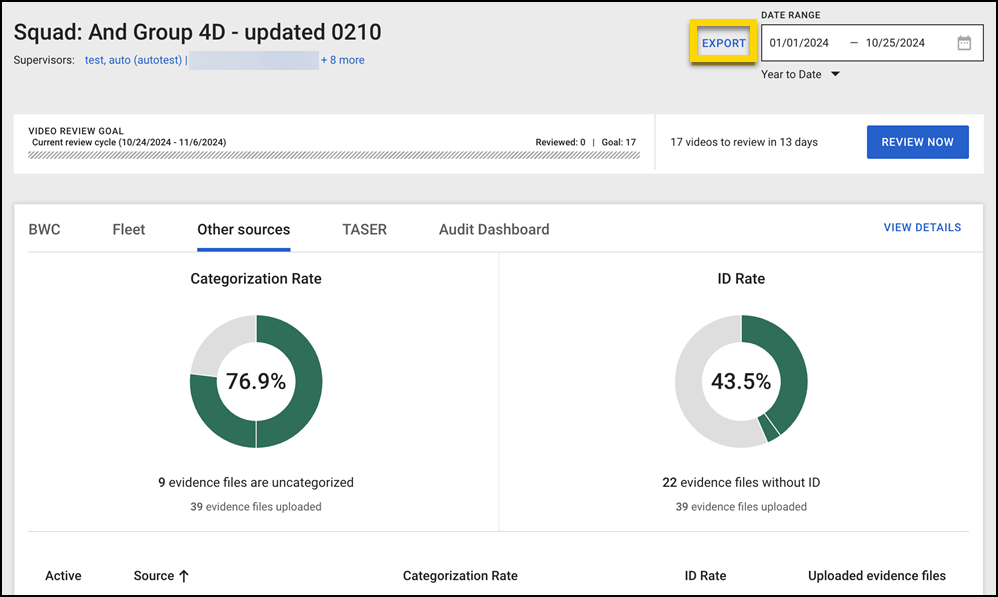
Can I export categorization and ID rate details for Other sources?
Yes, you can export these details at any level in the hierarchy (such as group, squad, or officer dashboards). Follow these steps:
- From any dashboard, select Export to open the Export reports pane.
- Under Reports, select Run next to Categorization rate details or ID rate details to generate a CSV report.
- After the CSV file is downloaded, open it and sort by evidence source (column I) to filter the data by source.