Squad Dashboard Overview
The Axon Performance squad dashboard provides insight at the squad-level, including visual indications of squad performance in relation to agency body-worn camera policies and, if enabled, Fleet camera, other sources (Community Request, Capture, User Uploads, Air, Interview, API Client), and TASER usage metrics. This allows supervisors to determine how compliant the squad is with agency policies and where there are opportunities for the team to improve.
In Axon Performance the term squad refers to a grouping of officers that report to the same field supervisor(s). This terminology may not be the same as the reporting structure for your organization. Units, shifts, or teams are typically synonymous with squad.
There are separate tabs to show BWC, Fleet, Other sources, TASER, and Audit Dashboard Metrics. The lower portions of the page show Squad Metrics, Squad Performance, and Video Reviews sections, each described below.
Watch this video to learn more about squad activation rate.
BWC metrics
The BWC Metrics tab displays compliance rates for all officers in the squad during the selected date range. Based on your agency’s configuration, up to four metrics may be shown:
- Categorization Rate: The number of BWC videos categorized during the selected date range compared to the total number of uncategorized videos.
- Power Cycling: The percentage of time the BWC is powered on while disconnected from an Axon dock.
- Activation Rate: The number of calls for service with an associated video compared to the total number of calls during the selected date range.
- ID Rate: The number of BWC videos with an officer-added or confirmed ID compared to the total number of videos without an ID.
- Power Cycling: The percentage of time the body-worn camera is powered on while disconnected from an Axon dock.
- Sleep Cycling: The percentage of the time the body-worn camera is not in sleep mode (“Active” state) while powered on and disconnected from the dock. This metric does not include the recording time of the officer's BWC in the numerator or denominator.
Metrics are updated in near real-time based on officer actions within the selected date range.
For example, if 42 videos were uploaded last week and 6 were not categorized, the Categorization Rate would show as 85.8 % for that week. If additional videos are categorized after the week ends, the rate reflects these updates when the date range is adjusted.
To view more details about a specific BWC metric, select the metric’s chart or select View Details.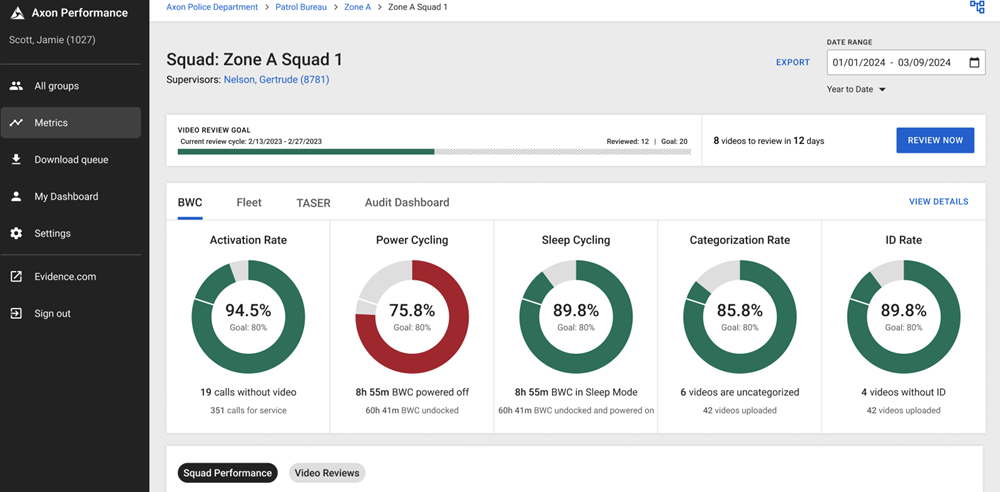
Fleet metrics
The Fleet Metrics tab shows Fleet 3 camera metrics for all officers in the squad for the selected date range. Depending on agency configuration, you may see up to three metrics:
- Categorization Rate: The number of videos categorized compared to the total number of uncategorized videos.
- Activation Rate: The number of calls for service with an associated video compared to the total number of calls.
- ID Rate: The number of videos with an officer-added or confirmed ID compared to the total number of videos without an ID. If two officers share the same vehicle, either officer can categorize or add an ID to a shared video, and both receive credit. However, only the primary officer’s activation rate is counted.
To view more details about a specific Fleet metric, select the metric’s chart or View Details.

Other sources
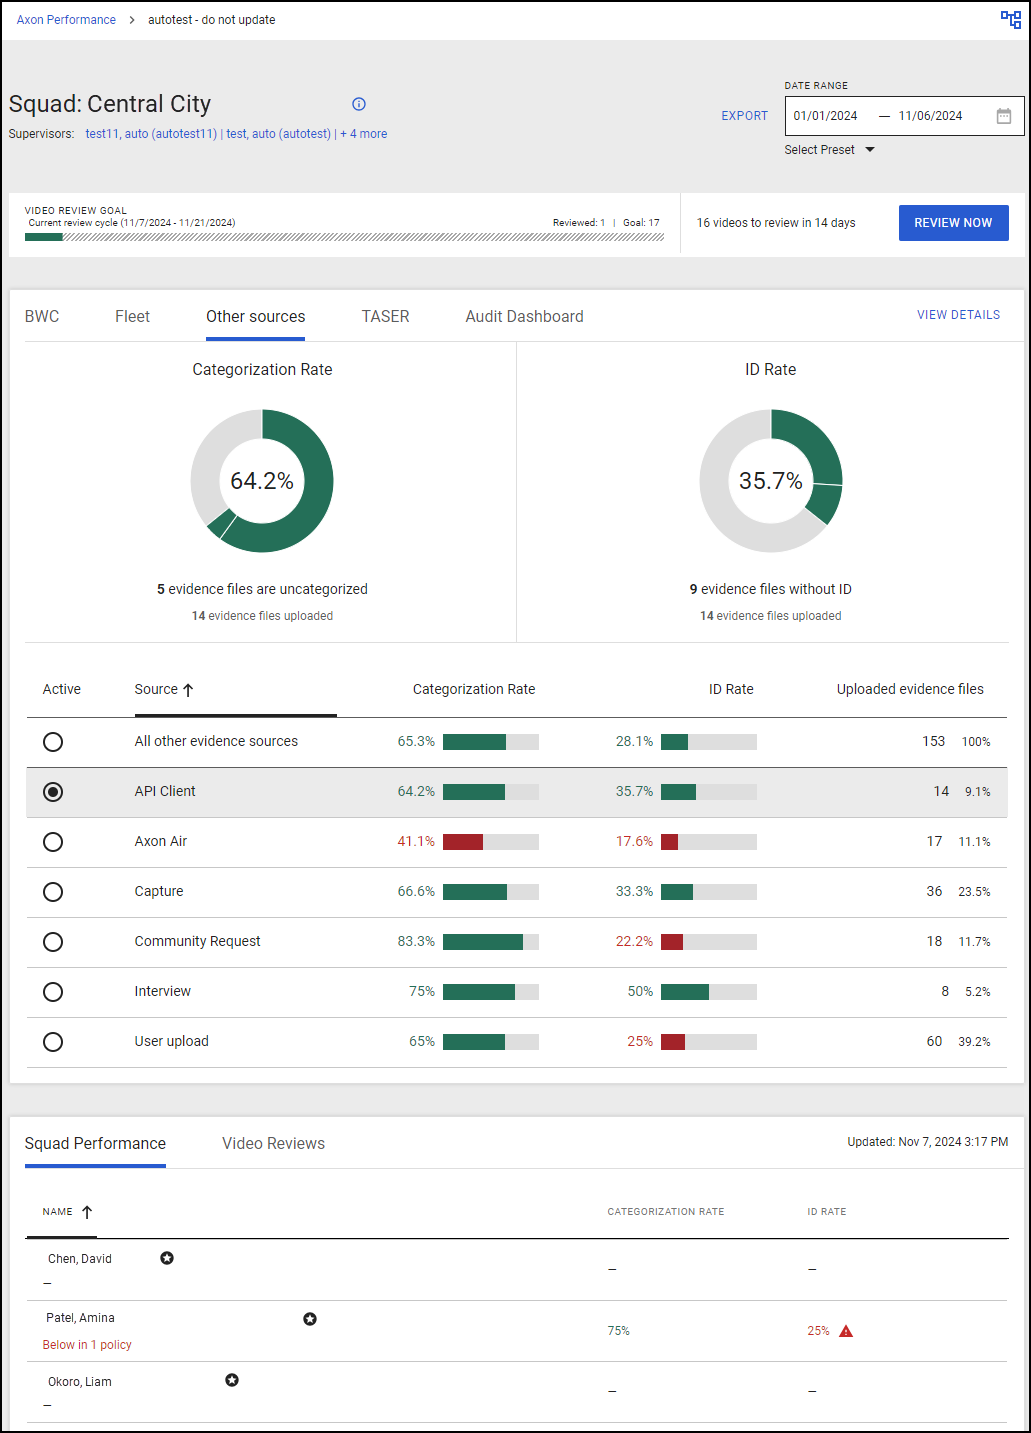
The Other Sources tab displays compliance metrics for additional evidence sources beyond BWC, Fleet devices for all officers in the squad during the selected date range. Depending on agency settings, you may see up to two metrics:
- Categorization Rate: The percentage of evidence categorized within the selected date range compared to the total amount of uncategorized evidence.
- ID Rate: The percentage of evidence with an officer-added or confirmed ID within the selected date range compared to the total amount of unidentified evidence.
Use the radio buttons to select an evidence source (e.g., API Client, Axon Air, User Upload). The donut charts and table below will display the categorization and ID rate for the selected source.
The table shows the total number of uploaded evidence files and the percentage each source represents across all enabled sources.
To view more details, select the metrics chart or View Details.
TASER metrics
The TASER Metrics tab shows TASER 7 metrics for all officers in the squad during the selected date range. Based on agency configuration, you may see up to six metrics: Armed Events, Arc Events, Trigger Events, Cartridge Deployment Events, Docking, and Function Tests.
Watch this video to learn how to configure the TASER dashboard.
TASER 7 batteries must be docked to display TASER metrics.
To view more details about a TASER metric, select the metric’s chart or View Details.
- Event zoom: Use the + and – buttons to zoom in on the timeline for detailed event information.
- Docking information: Select the number of TASERs not docked to view a list of undocked devices. Selecting a device number opens its Device Detail page in Axon Evidence.
- Function test information: Select Function Test to see a list of test events. Selecting a device number opens its Device Detail page.
Audit dashboard
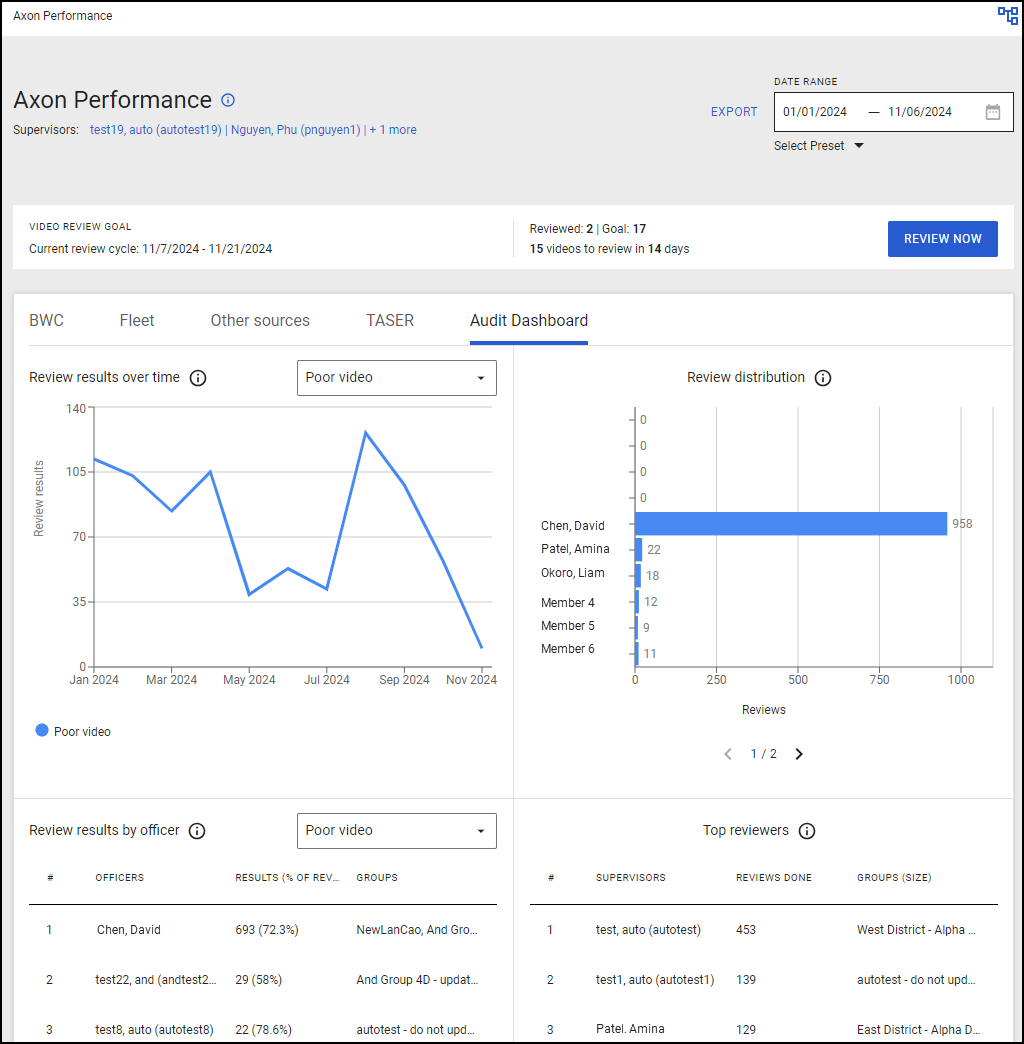
The Audit Dashboard provides insights into video audit results conducted by supervisors or command staff. This dashboard aggregates video reviews over time to highlight trends and inform data-driven decisions.
- Review Results Over Time: Shows how frequently specific responses are selected over time.
- Review Distribution: Lists officers and the number of reviews they’ve received from supervisors.
- Review Results by Officer: Sorts officers by specific review results, such as late activations.
- Top Reviewers: Displays supervisors ranked by the number of reviews completed.
Squad performance and video reviews
The Squad Performance and Video Reviews sections in the squad dashboard allow supervisors to monitor detailed performance metrics for groups, squads, or individual officers, along with video review data for the selected date range.
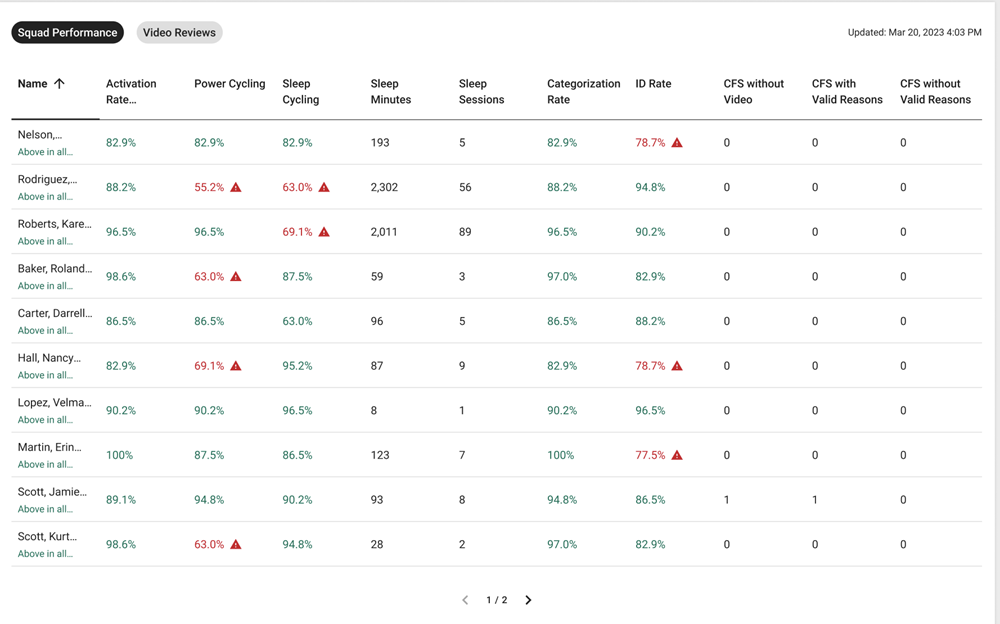
- Group Performance:
- Metrics: Displays metrics for each group, squad, or individual officer, helping supervisors assess compliance with agency standards.
- Sorting: Select any column header in the Group Performance tab to sort the data by that metric.
- Drilling Down: Select a group name to open the specific squad dashboard for that group. Select the down arrow next to a group to expand it and display all supervisors within that group. Selecting a supervisor’s name opens their individual dashboard.
- Filtering: Use the search bar to filter data by supervisor or squad name.
- Video Reviews:
- Metrics: Shows a list of video reviews conducted within the organization, including details such as review dates, reviewer names, and the current status of each review.
- Sorting: Select any column header in the Video Reviews tab to organize the data by that field.
- Filtering: Use the search bar on the Group Performance tab to filter video review data by supervisor or squad.
These sections automatically adjust to display data relevant to the selected date range.