Reviewing Overall Squad Performance
Watch this video to learn how to review squad performance.
Access the squad dashboard
- Sign in to your Axon Evidence account.
- On the dashboard page, under Axon Performance, select Launch Performance
- Select Performance Metrics. If you supervise more than one squad, on the Squad Selection page, select the name of the squad you want to review.
- In the Squad Metrics section, review the metrics for the squad. These metrics adjust based on the date range selected.
- Choose the Date Range for the review period. The different date range options are described below:
| Date Range | Description |
|---|---|
| Yesterday | The previous calendar day. |
| This Week | The current calendar week, starting at midnight on Sunday. |
| Last Week | The previous calendar week, from midnight on Sunday until 11:59 (23:59) on Saturday. |
| This Month | The current calendar month, starting at midnight on the first day of the month. |
| Last Month | The previous calendar month, from midnight on the first day of the month until 11:59 on the last day of the month. |
| Year to Date | The current calendar year, from midnight on January 1 until the current date. |
| Last Year | The previous calendar year. |
| Custom | The date range defined by selecting the start and end dates. |
Review metrics in the squad dashboard
The Squad Metrics section displays performance metrics for the selected date range. Each metric is updated based on officer actions and provides a quick snapshot of compliance and performance data across the squad.
Available Metrics
- Categorization Rate: Shows the percentage of BWC videos categorized during the selected date range, along with the total number of categorized videos.
- Activation Rate: Displays the percentage of calls for service during the selected date range that have an associated video, compared to the total number of calls.
- ID Rate: Reflects the percentage of BWC videos uploaded with an officer-added or confirmed ID, along with the total number of videos without an ID.
- Power Cycling: Shows the percentage of time the BWC was powered on while disconnected from an Axon dock.
- Sleep Cycling: The percentage of the time the body-worn camera is not in sleep mode (in “Active” state) while powered on and disconnected from the dock. This metric does not include the recording time of the officer’s BWC in the numerator or denominator.
For more details about a specific BWC metric, select the chart or View Details.
Use the squad metrics details page
On the Squad Metrics Details page, you can view additional information for each metric, including real-time and historical data.
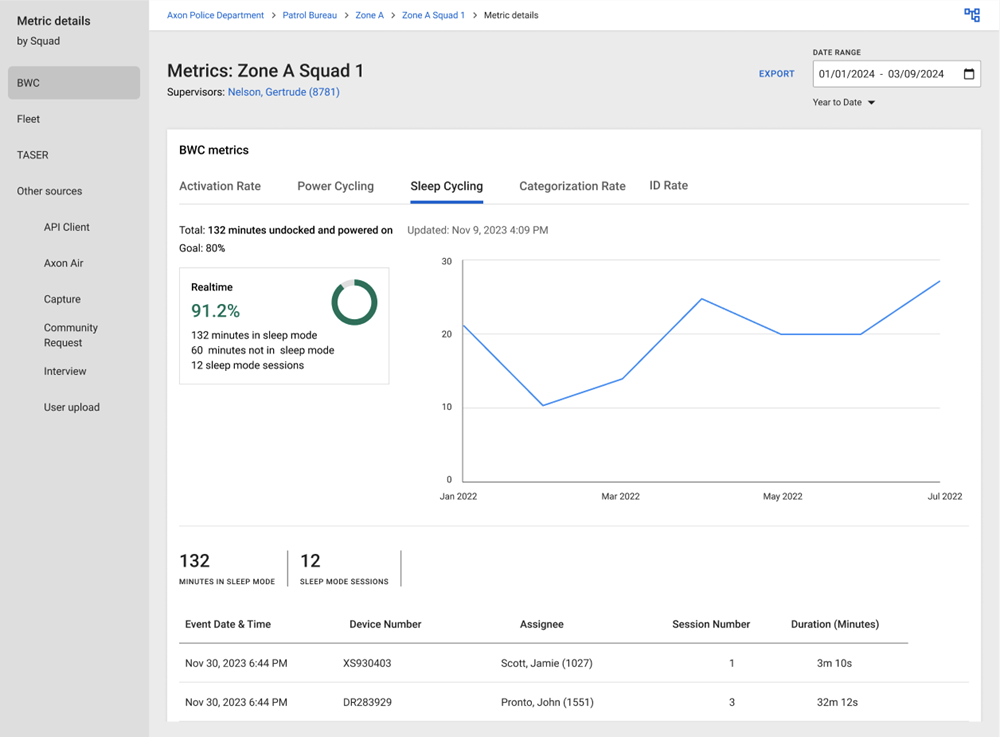
- Real-Time Data: The upper section of the page displays a graph showing real-time activity for the selected date range. Real-time calculations are based on officer actions and may change as more data is uploaded. Realtime view applies to all uploaded evidence in Axon Evidence.
- Historical View: Select Show Historical view to add a historical trend line. The Historical View takes into account the grace period that is set by your agency. If evidence has been uploaded within the grace period, it will not impact these metrics.
The lower part of the Squad Metrics Details page shows all items within the selected date range. The date and time information is adjusted to reflect your time zone, which is set in your Axon Evidence profile.
To return to the squad dashboard, select Back to Dashboard.
Review TASER metrics
The TASER Metrics tab provides compliance data for TASER 7 usage across the squad during the selected date range. These metrics, based on your agency’s configuration, may include Armed Events, Arc Events, Trigger Events, Cartridge Deployment Events, Docking, and Function Tests.
- Event Timeline: The upper section displays a timeline of TASER events for the selected date range.
- Event List: The lower section lists each event, including links to associated videos and devices.
To view specific event details, select the metric or View Details.
Squad performance and out-of-compliance conditions
The Squad Performance section highlights compliance with agency policy requirements. Officers who do not meet compliance standards are flagged, with non-compliant metrics shown in red text.
- Identifying Non-Compliance: Red text indicates that an officer is below the set threshold for a specific policy requirement. Select the officer’s name to open their Officer Page and review the metrics for further details.
- Creating a Policy Review: If an officer is out of compliance, select New Policy Review on the Officer Page to create a policy review specific to the out-of-compliance condition. For more details, see Identifying Out-of-Compliance Conditions.