Dashboard overview
Understand how to use dashboards to monitor system activity, view alerts, and communicate with your team. The Dashboard’s appearance and available tiles may vary by agency configuration and user role.
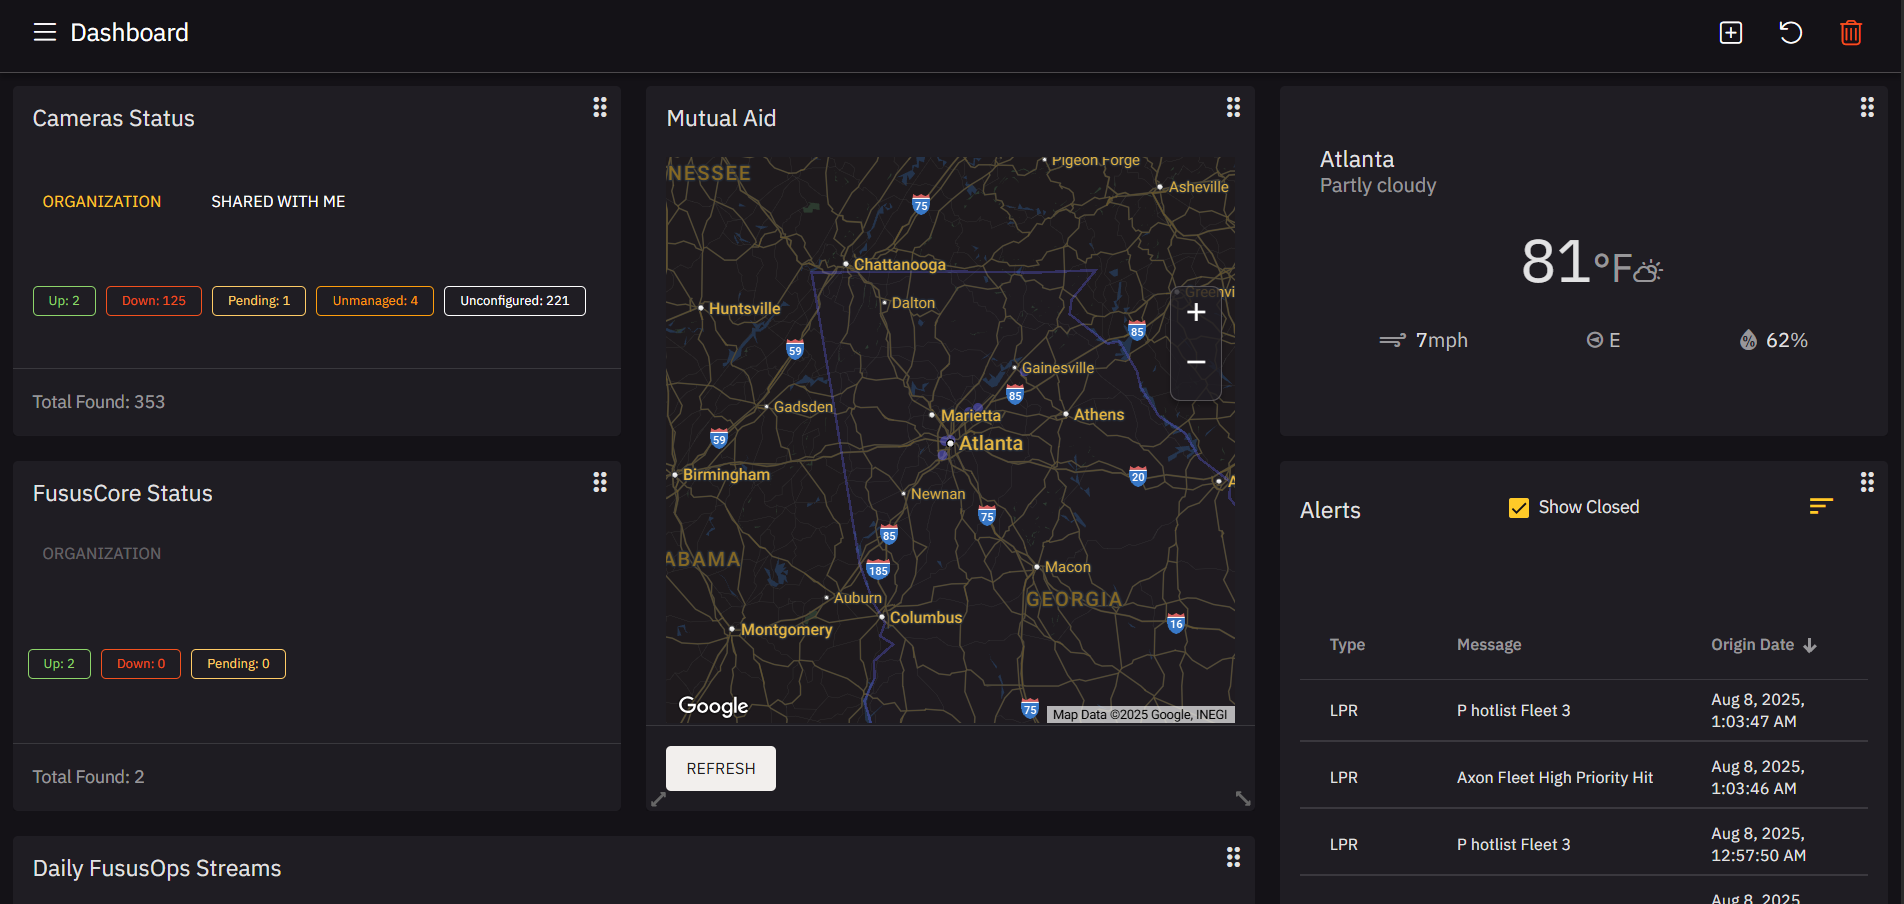
- In the navigation panel (navbar), select Dashboard.
- Review key tiles and panels. You can select the Down status in each widget to review a list of down devices.
- Camera Status
- Fusus Core Status
- Use filters (e.g., Show Closed) to refine alerts.
- Click any listed alert to open additional detail views.
- Use the Refresh button at the bottom of a panel to update Dashboard data manually.
- Look for settings icons (where present) to configure panel behavior or visibility.
- Resize tiles by dragging the edges or rearrange them by grabbing the drag handle (six dots).