Dashboard management
Users with specific privileges can edit, save, and delete/archive the dashboards that appear in Axon Records and Axon Standards. You can also view an activity log of all actions taken on that dashboard.
Although you access the dashboards within Axon Records or Axon Standards, you use embedded Power BI capabilities to edit them.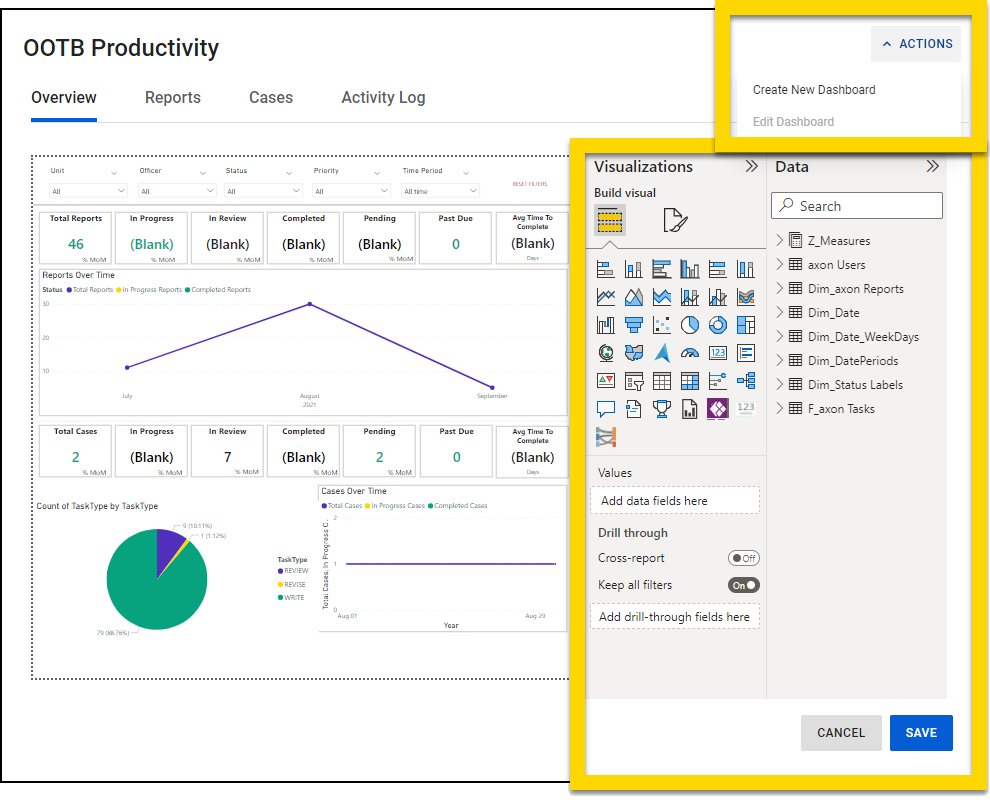
Create dashboards
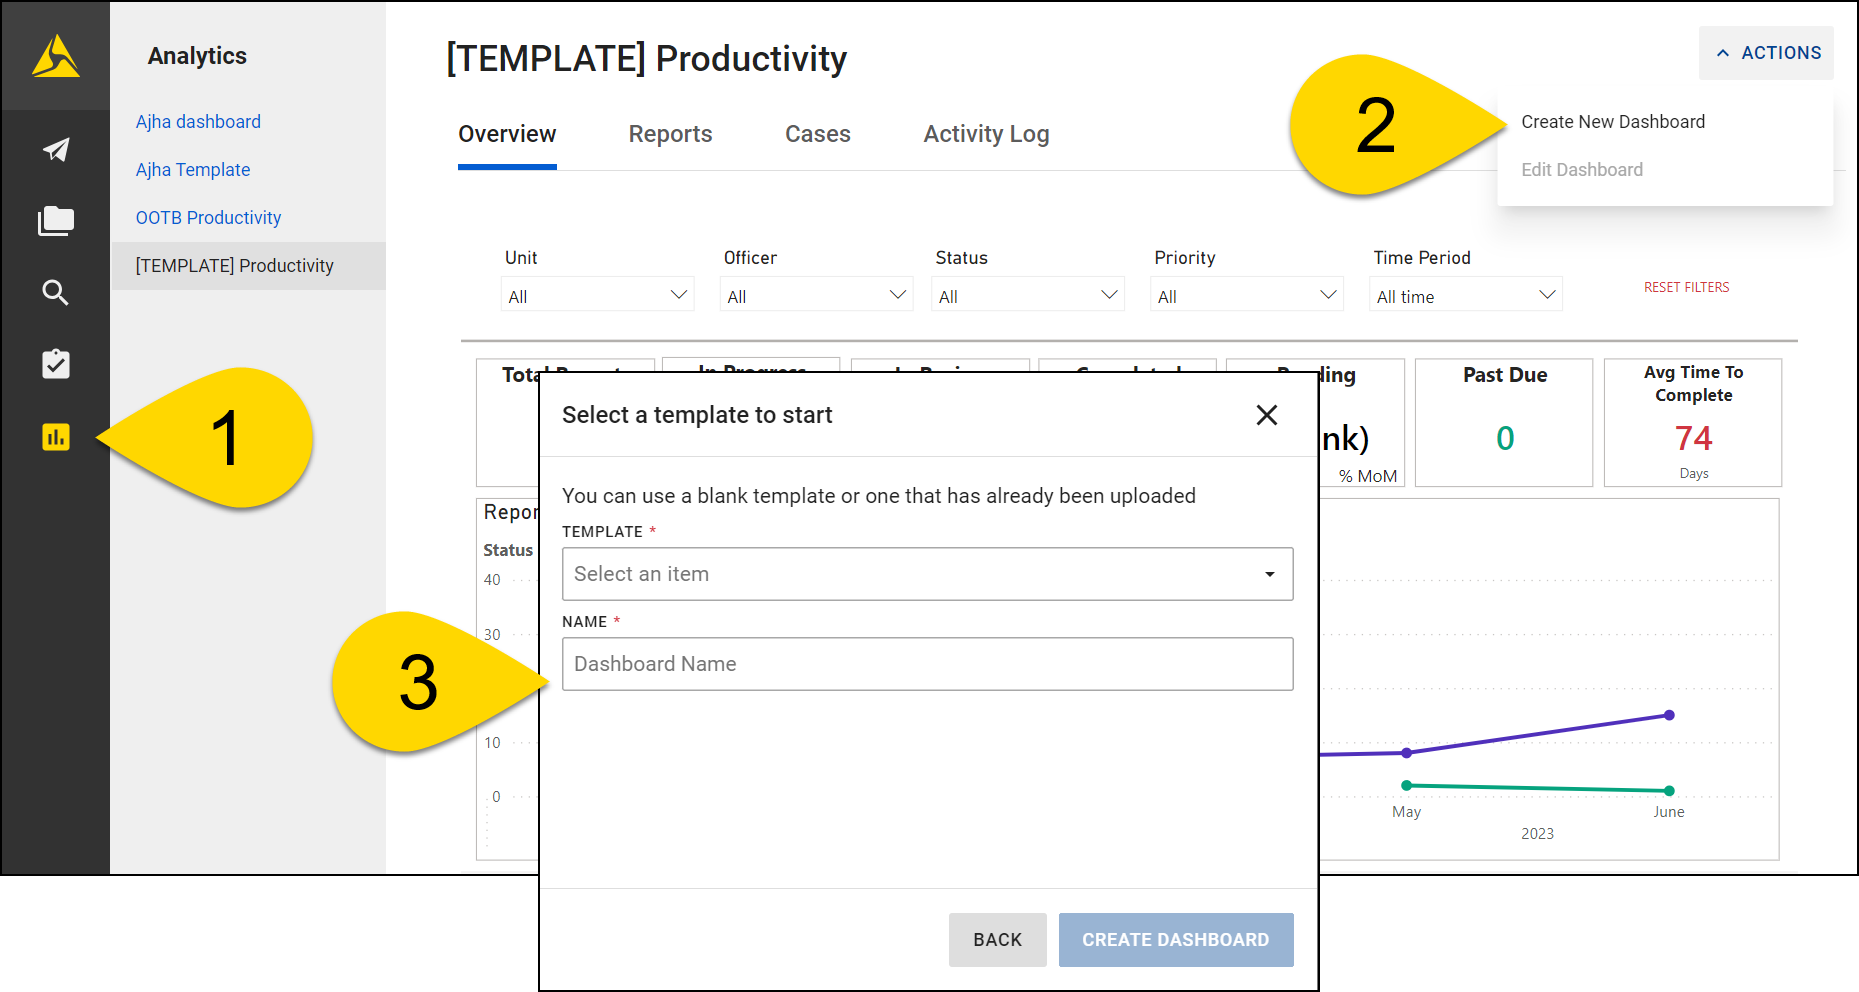
To create a new dashboard from the Analytics module, take these steps:
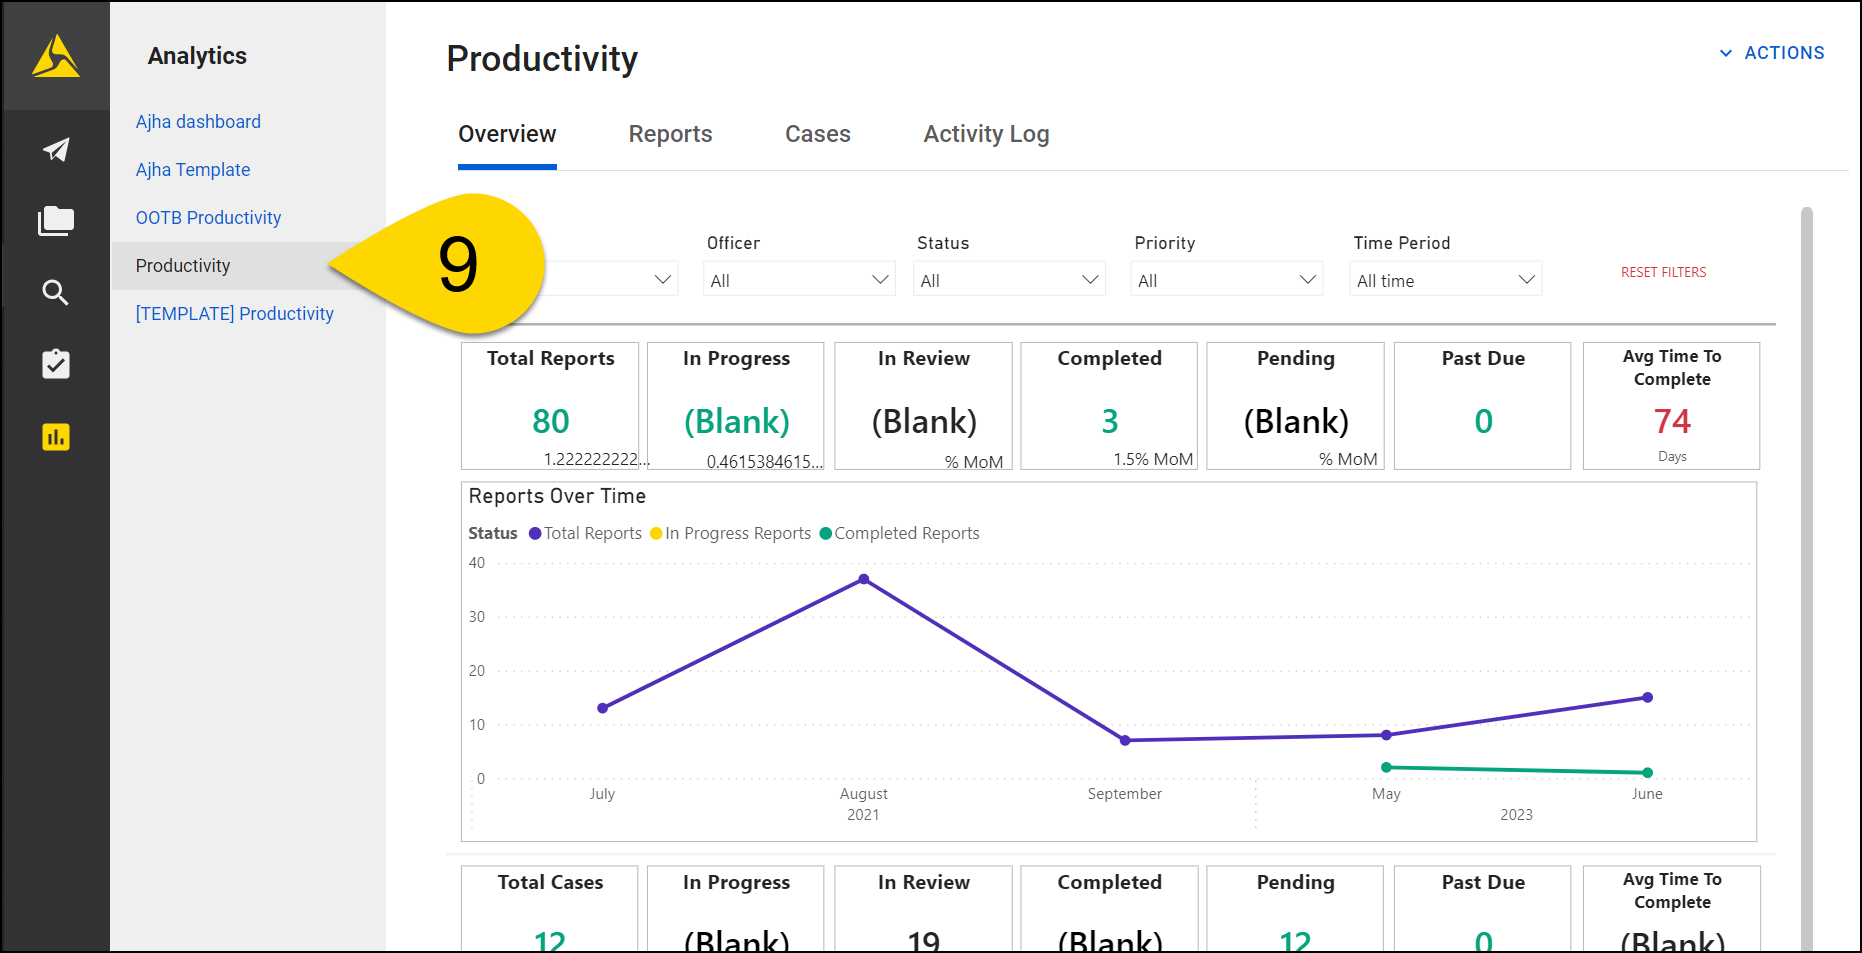
- Open the Analytics module.
- While viewing any of the existing dashboards, select Actions > Create New Dashboard.
- Select a template to serve as the basis of your new dashboard, give it a name, and select Create Dashboard.
- The new dashboard will not immediately appear in the list of available dashboards on the left side of the page because you need to grant yourself the privilege to view it. To do this, open the Administrator Console and select Command Hierarchy & Teams.
- Select either the Command Hierarchy or Teams tab.
- Select the Command Hierarchy group or team you want to view the new dashboard.
- Select the Privilege Sets View tab.
- Expand the Analytics - view privilege section and select Allow on the new dashboard.
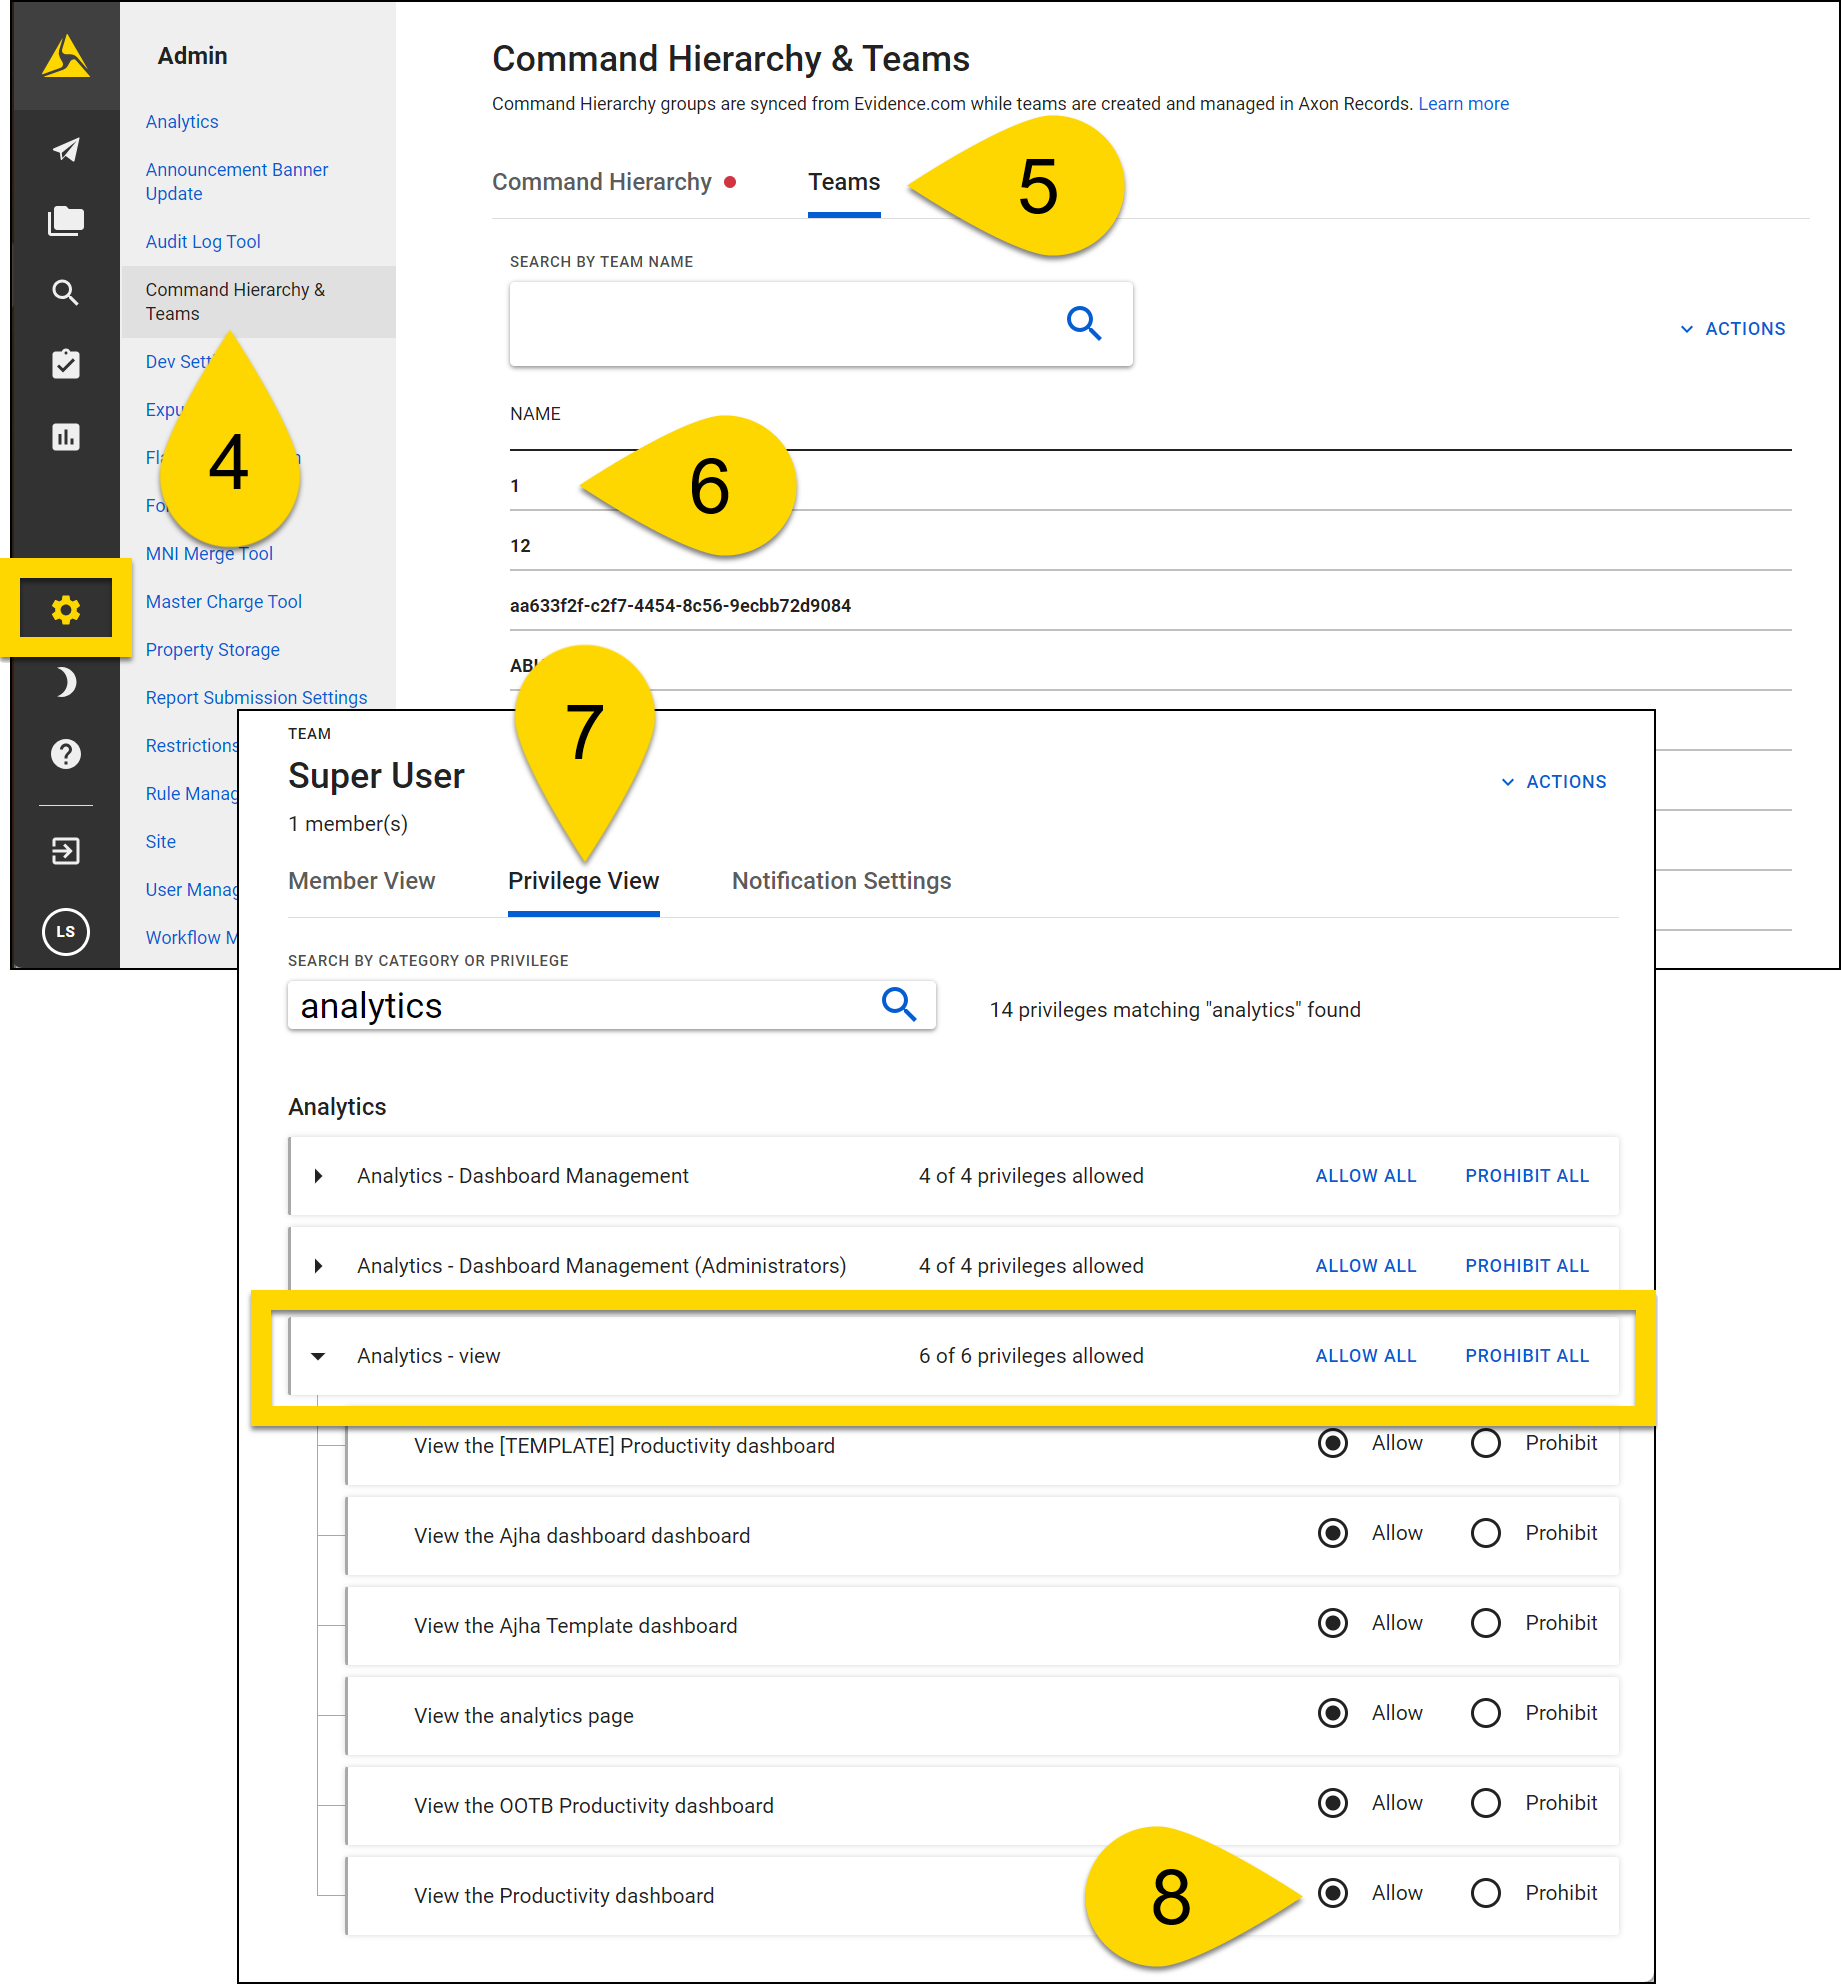
- When you next open the Analytics module, the new dashboard will appear in the list.
Edit dashboards
Users with the appropriate privileges can edit dashboards in one of two ways:
- Edit titles and tabs
- Edit visualizations
See Quick tips for other ways to edit dashboards and visualizations.
Edit titles and tabs
To edit the dashboard title or tabs, take these steps:
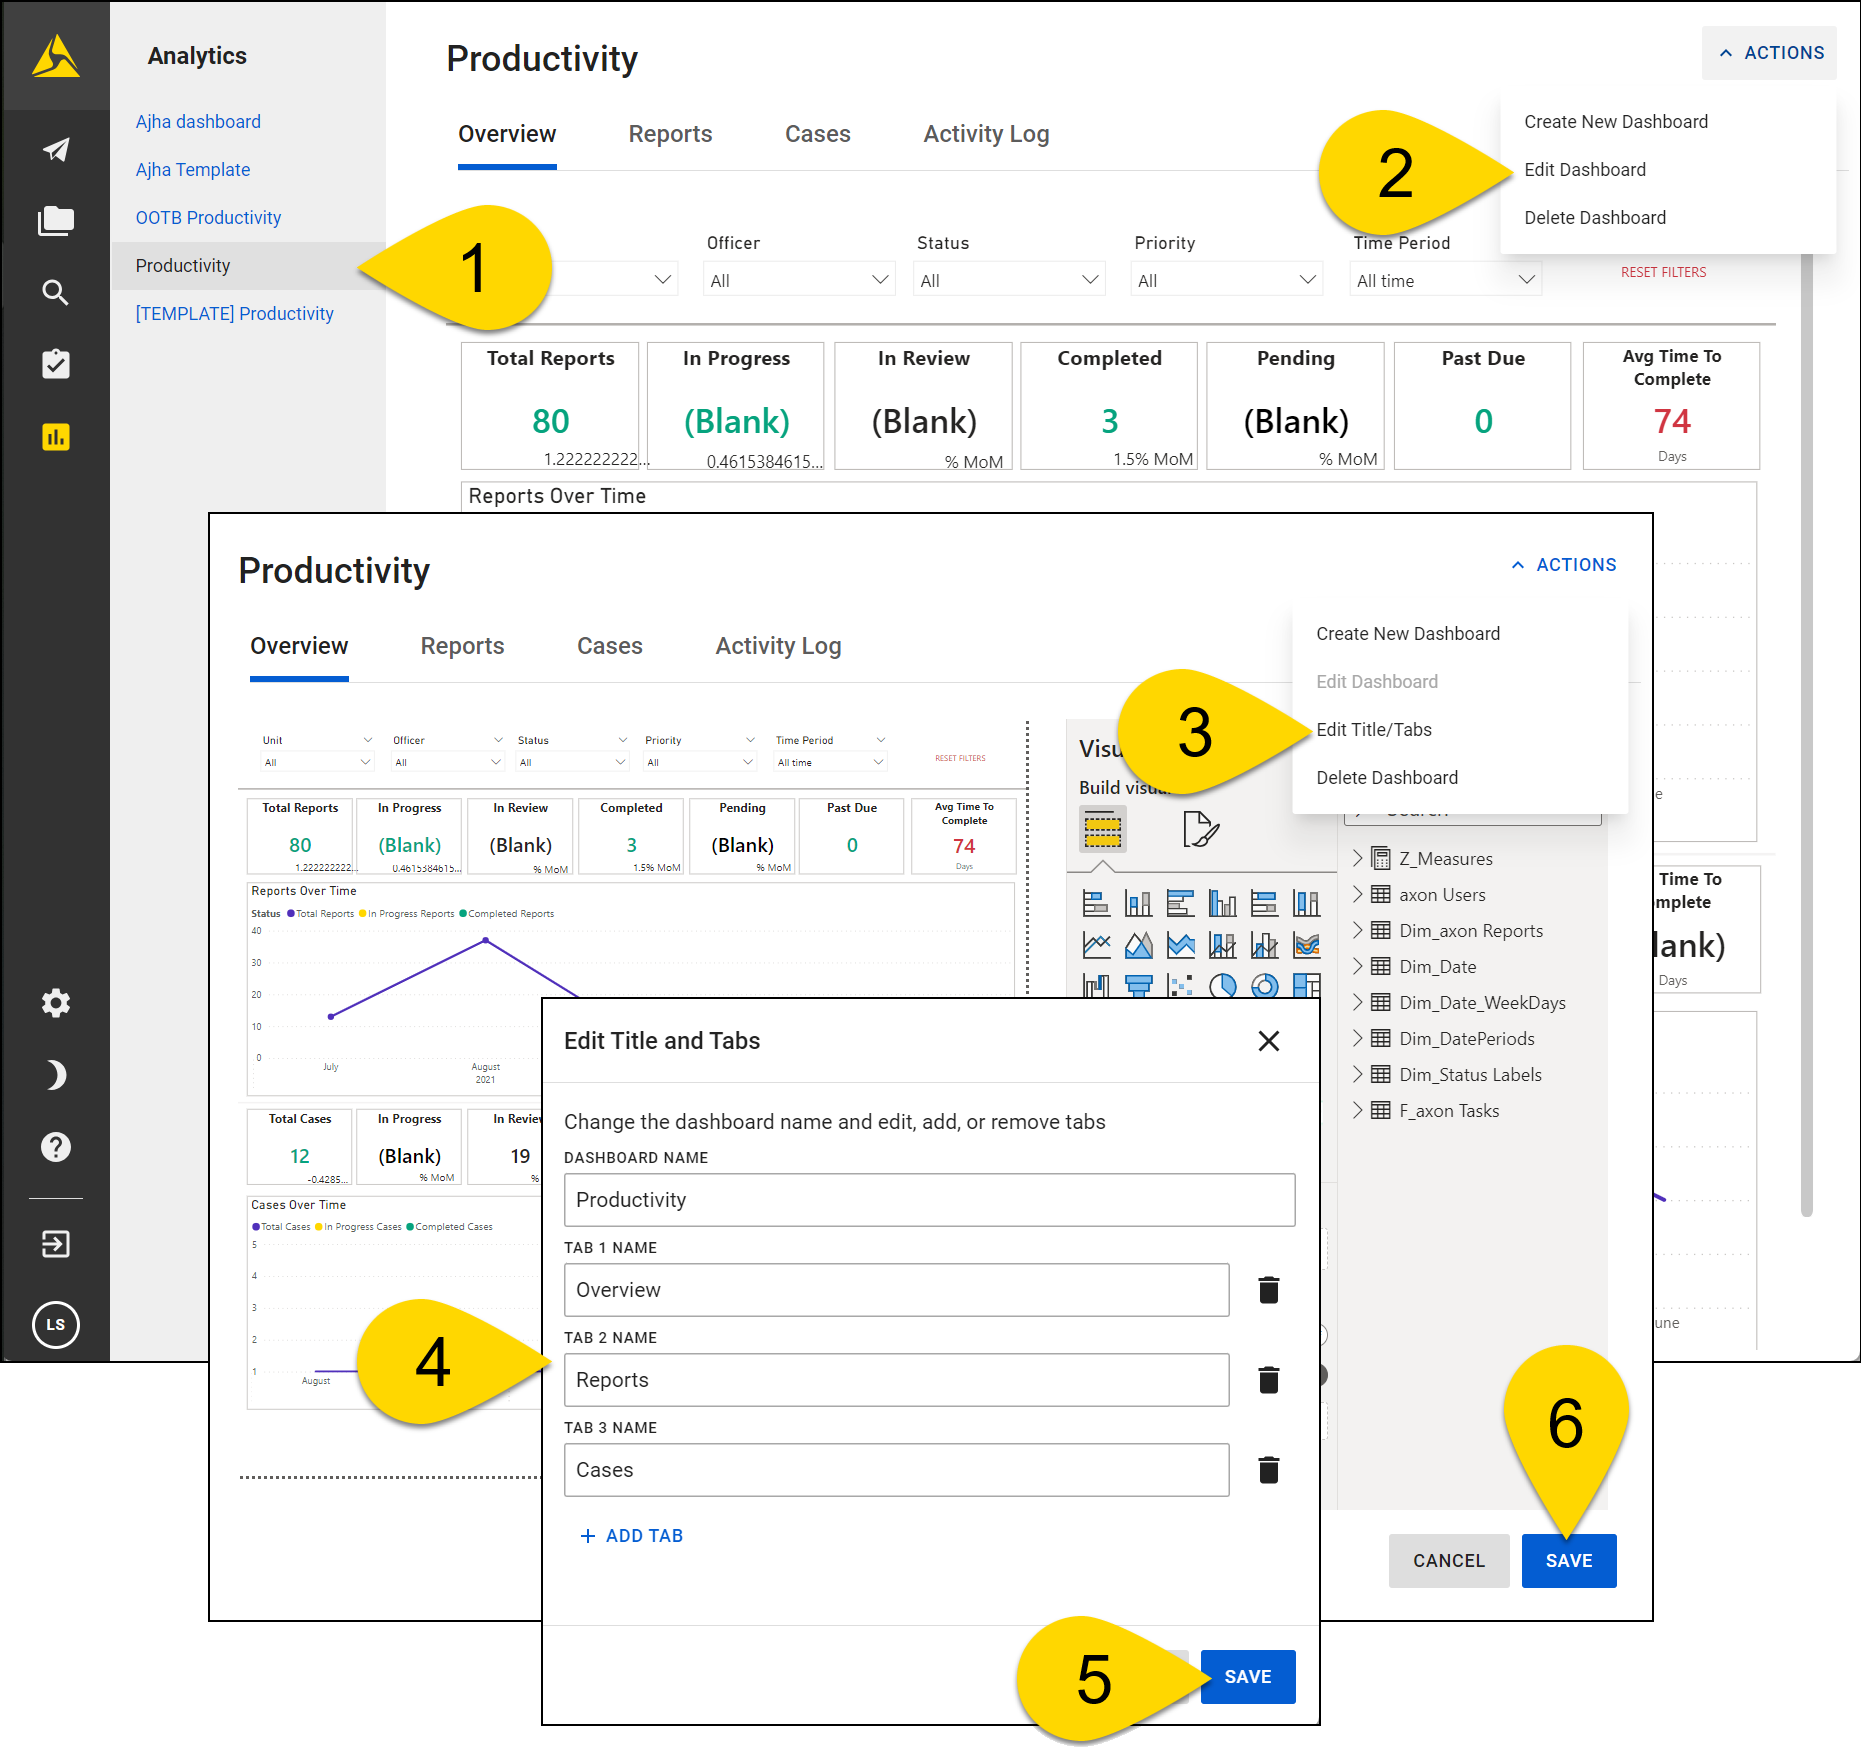
- Open the Analytics module to the dashboard and select Actions > Edit Dashboard.
- When the page re-loads, select Actions > Edit Title/Tabs.
- Update the dashboard or tab names, add new tabs, or delete tabs.
- Select Save.
- Select Save again to save the changes to the dashboard.
Edit visualizations
To edit the visualizations shown on a dashboard, open the dashboard and select Actions > Edit Dashboard. When the page re-loads, you'll see two new panes on the right side of the screen:
- Visualizations: A large toolbox that lets you edit the dashboard's existing visualizations and add new ones
- Data: All the data available to be represented in the visualizations on the dashboard. If you select a visualization, yellow checkmarks appear beside the data fields that are used in that visualization.
See Tour the report editor in Power BI for a detailed overview of these new panes. Note that in this article, the Data pane referred to as the Fields pane. Additionally, the article refers to a Filters pane, which isn't visible in Axon Records and Axon Standards.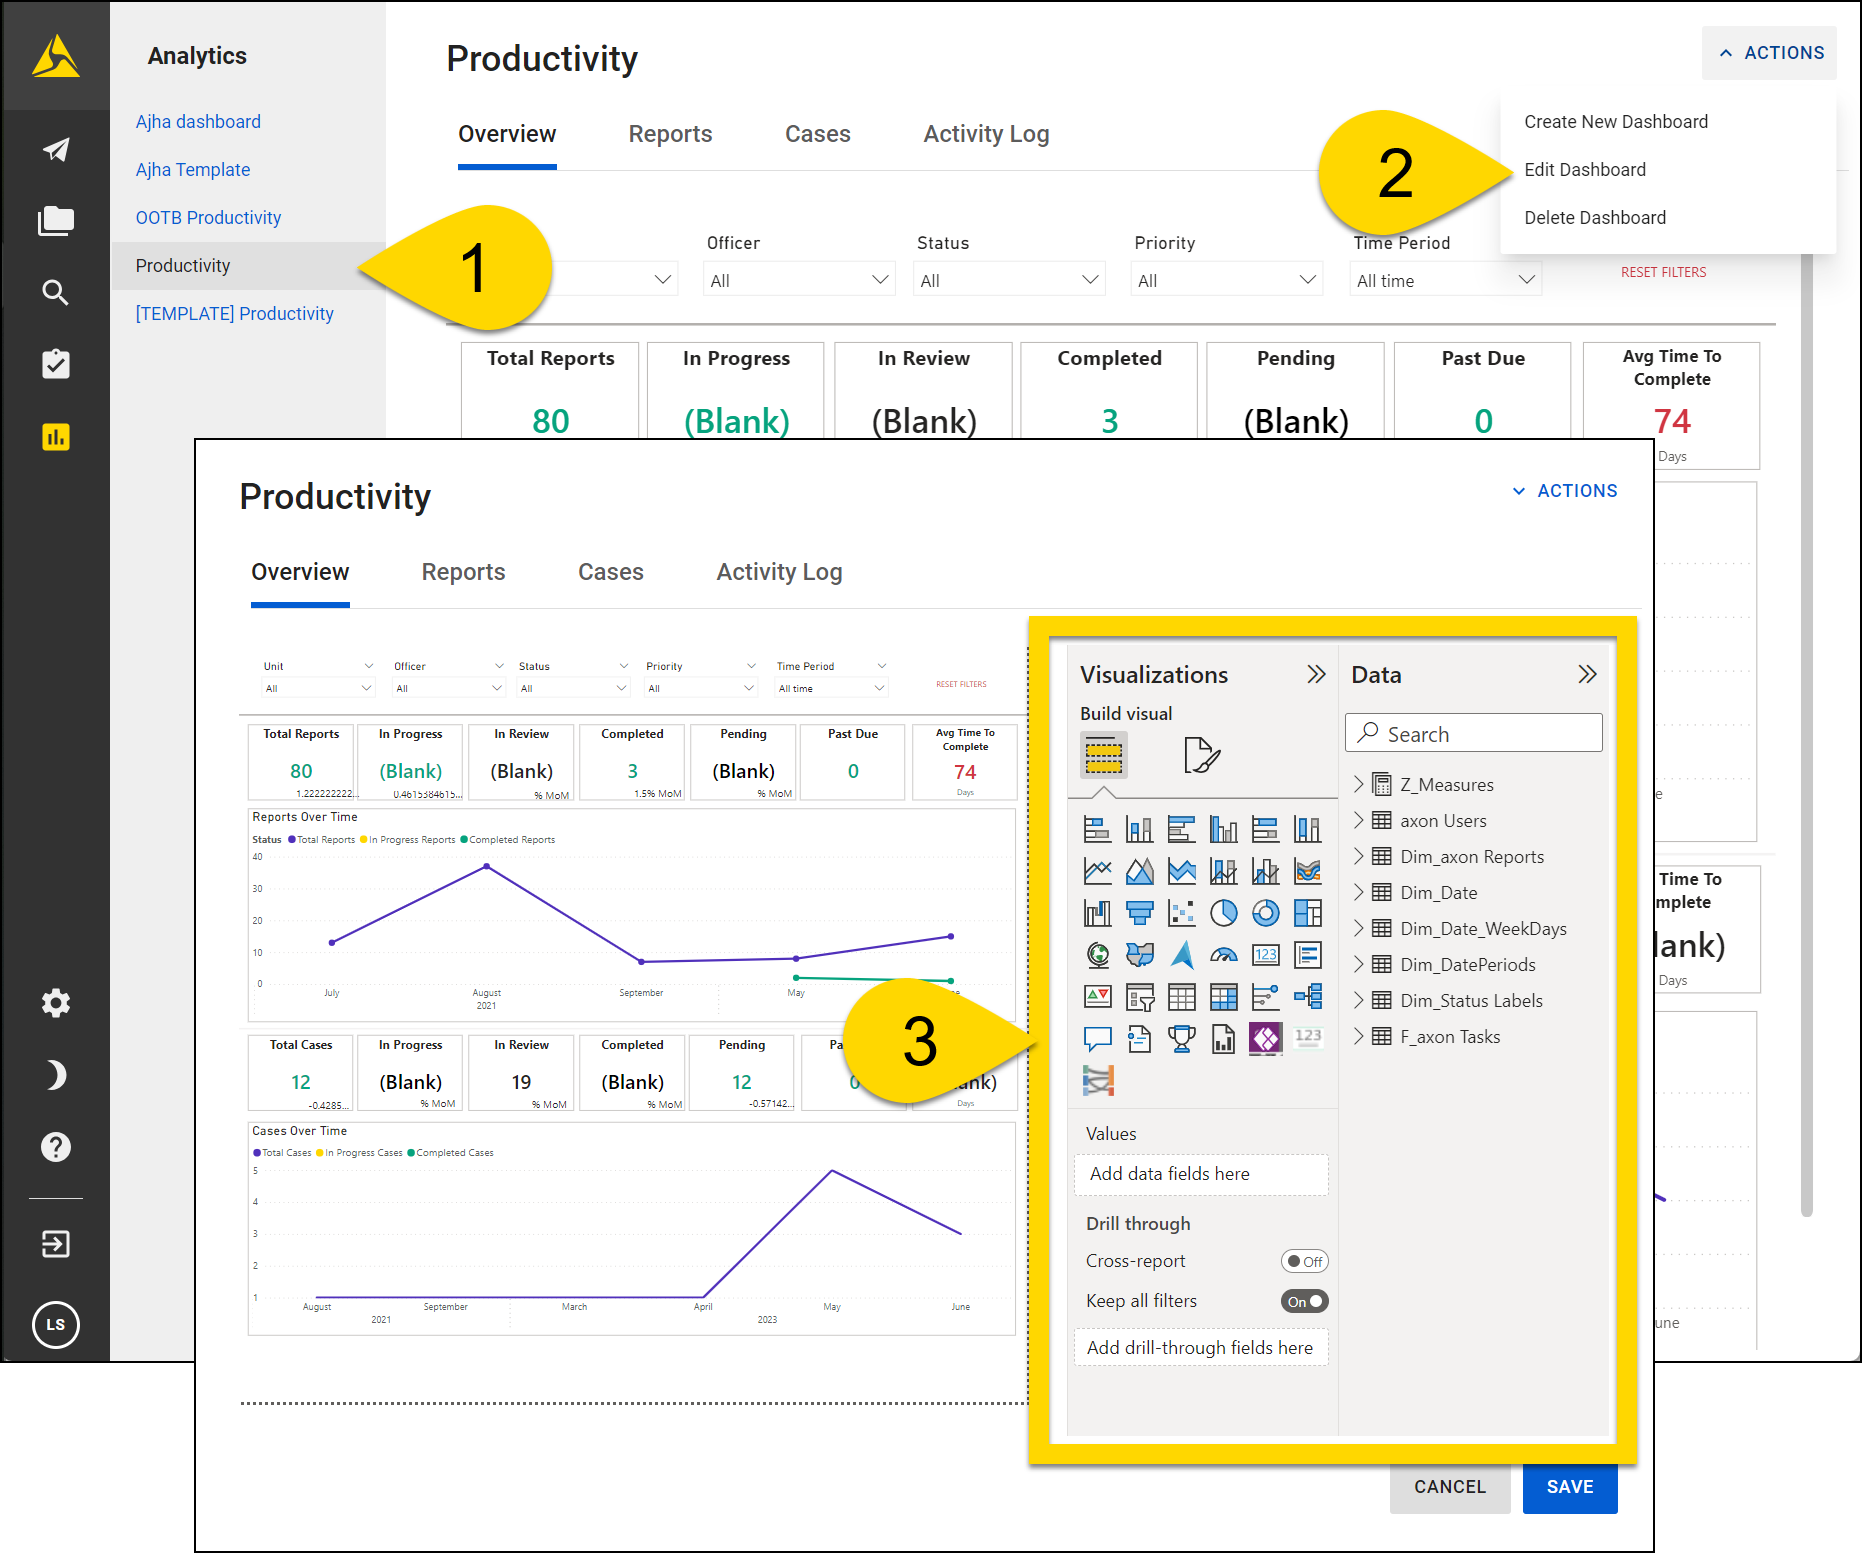
See the Power BI documentation links below for information about the different visualization types, and how to add them to a dashboard.
- Types of visualizations: Explains all the different types of you can add to your dashboards.
- Note that not all of these visualizations are available in Axon Records and Axon Standards
- Drill mode in the Power BI service: Adding drill downs or drill ups lets your users interact with your visualizations and find additional information as desired.
- Interact with an ArcGIS map in Power BI
- Change the type of visualization in a Power BI report
- Add visuals to a Power BI report: Note that you can skip the first section (Prerequisites) and jump straight to the second section.
- Field list icons: Explains the different types of fields that appear in the Data pane
You can also use the search bar in the top left corner of the Power BI documentation to search for content by keyword.
Quick tips
Click and drag to move a visualization or use the tick marks to change its size.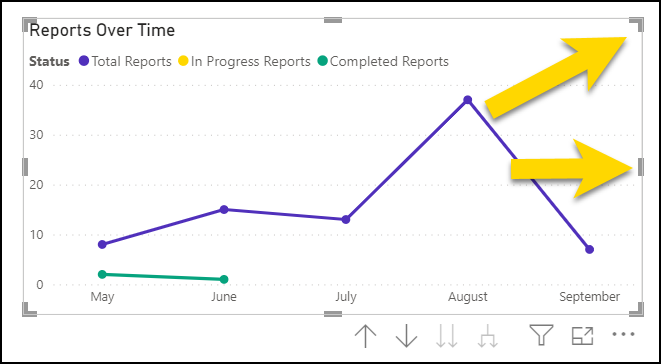
Select a visualization to reveal a menu with additional options.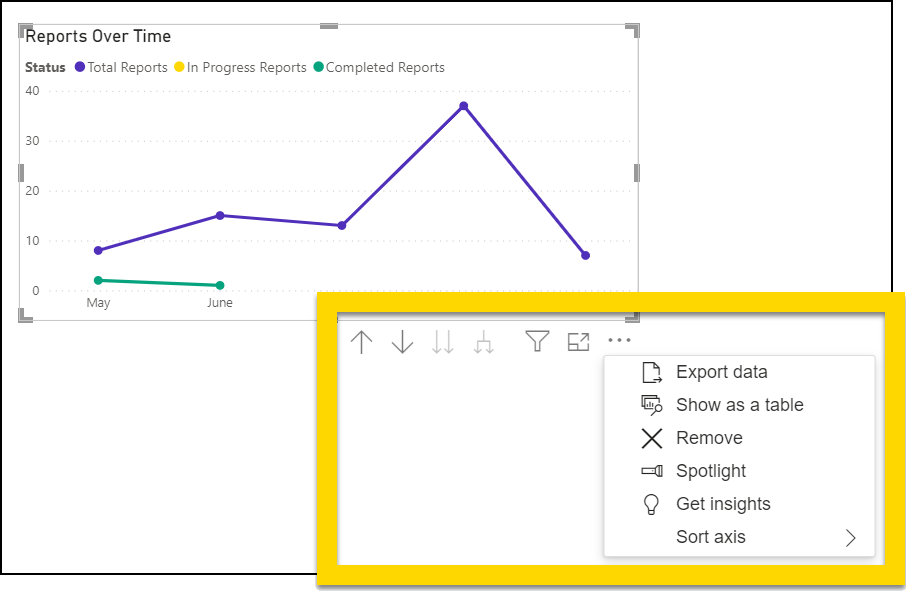
Use the Spotlight option to open a single visualization on its own page for easier viewing and editing.
Right-click anywhere on a visualization to reveal additional options.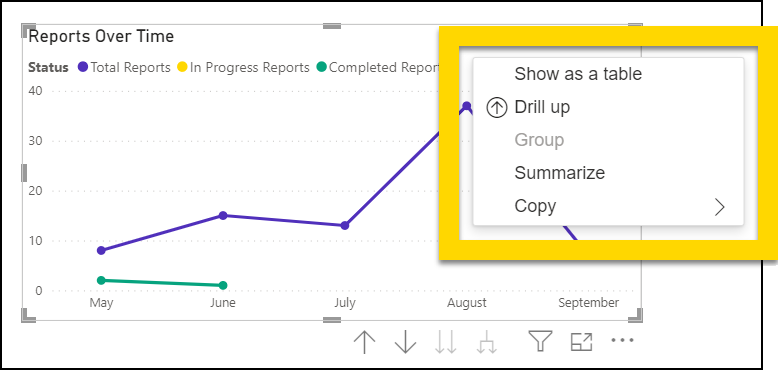
To increase the size of either the Visualizations or Data panes, hover your cursor over the left edge of the pane until it turns into a double-arrow cursor . Click and drag to the left to increase the size of the pane.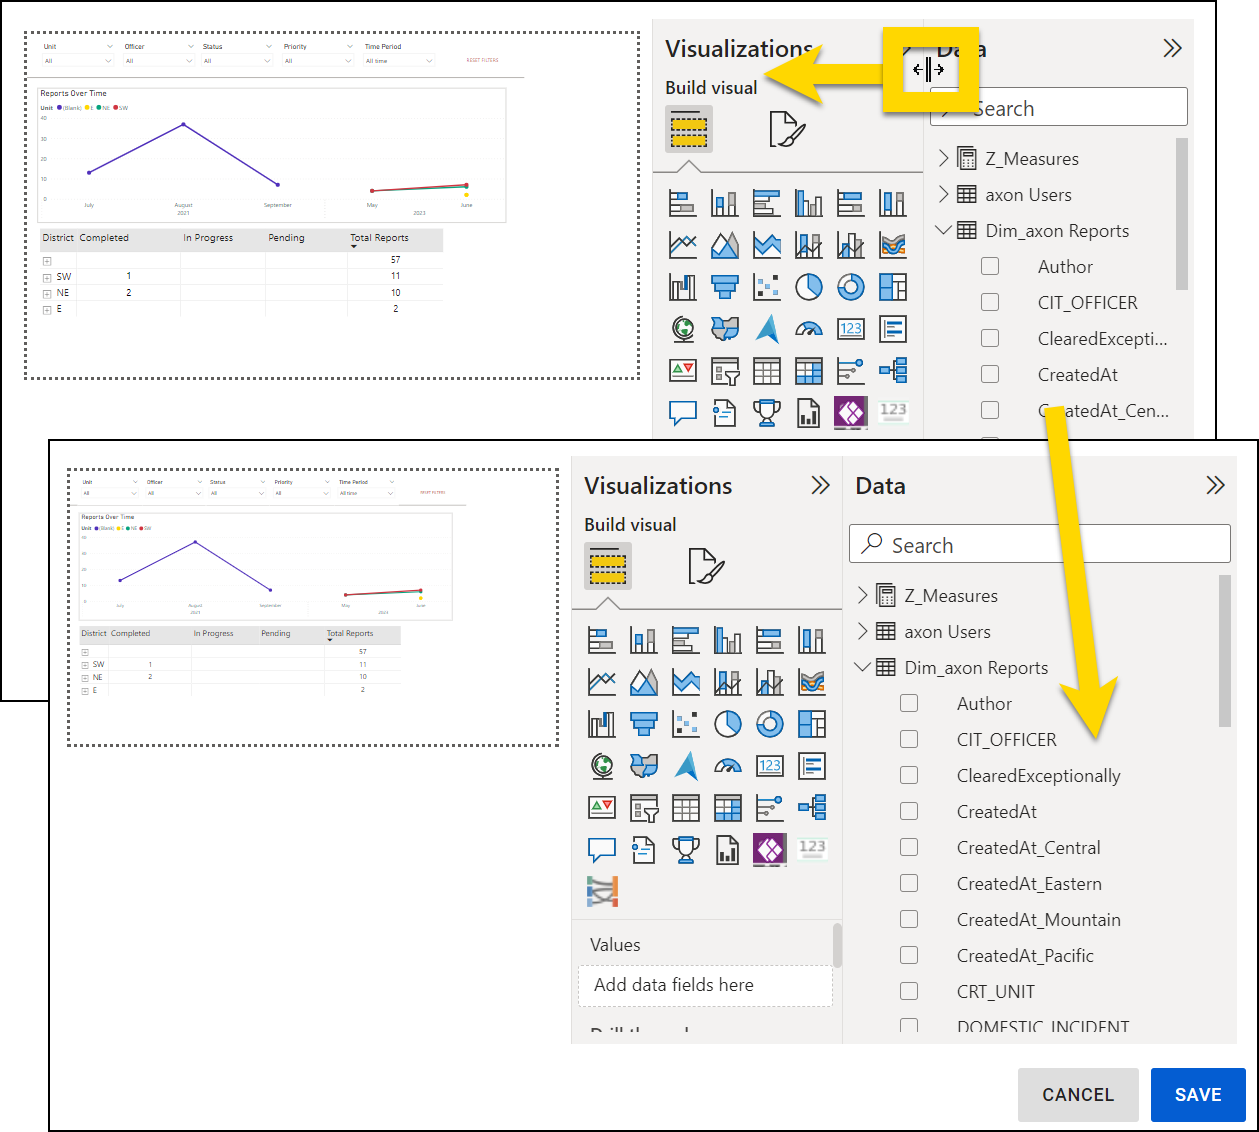
Save dashboards
After making changes to an Analytics dashboard, select Save.
Selecting Cancel discards any changes made on a tab but does not discard any new tabs that have been created. To delete a tab, select Actions > Edit Title/Tabs.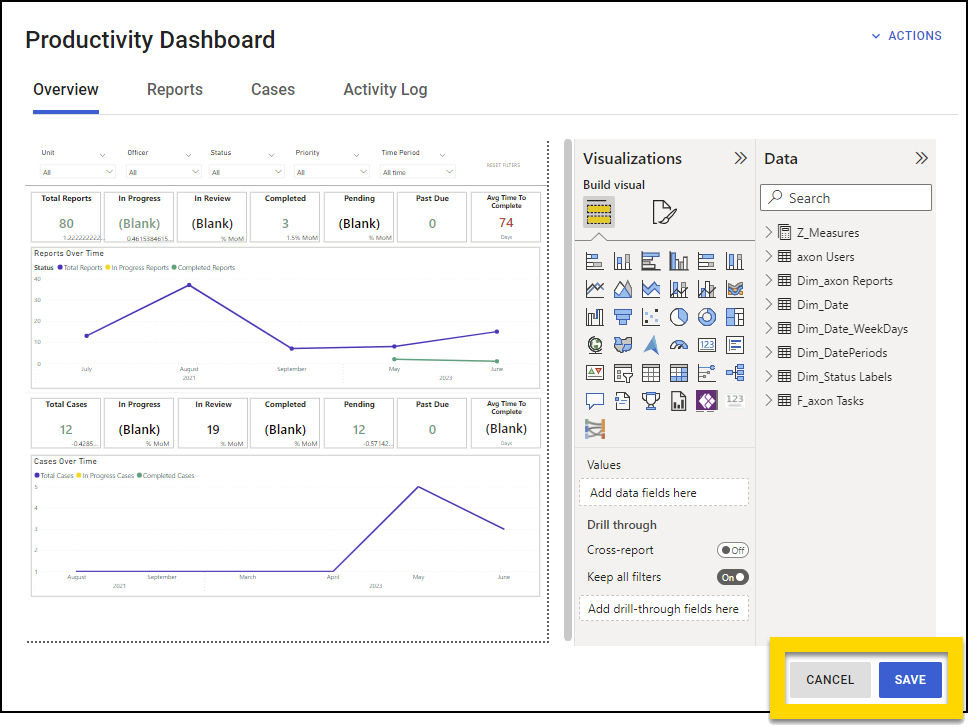
Delete and archive dashboards
To delete or archive a dashboard, open the dashboard and select Actions > Delete Dashboard. You can then select if you want to permanently delete the dashboard or archive it.
Archived dashboards can be restored from the Analytics tool in the Administrator Console.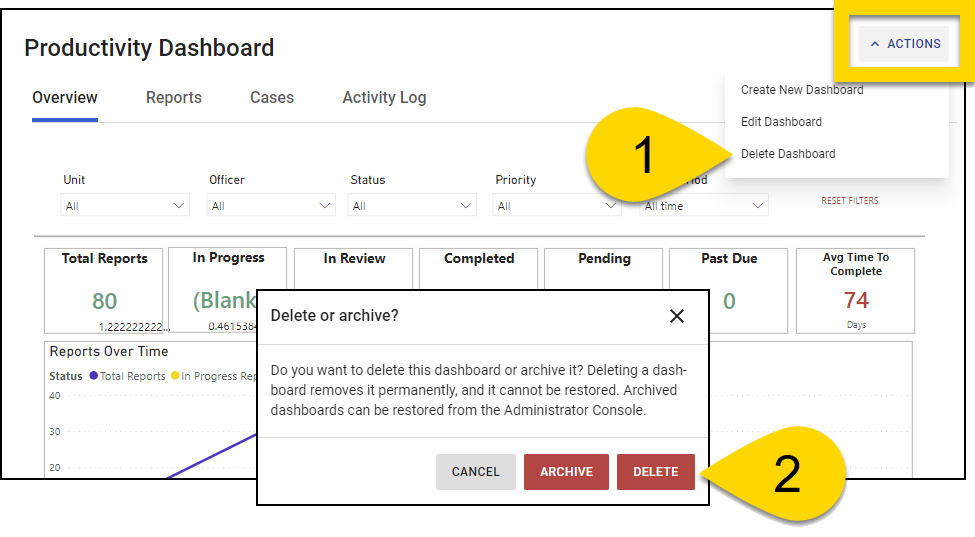
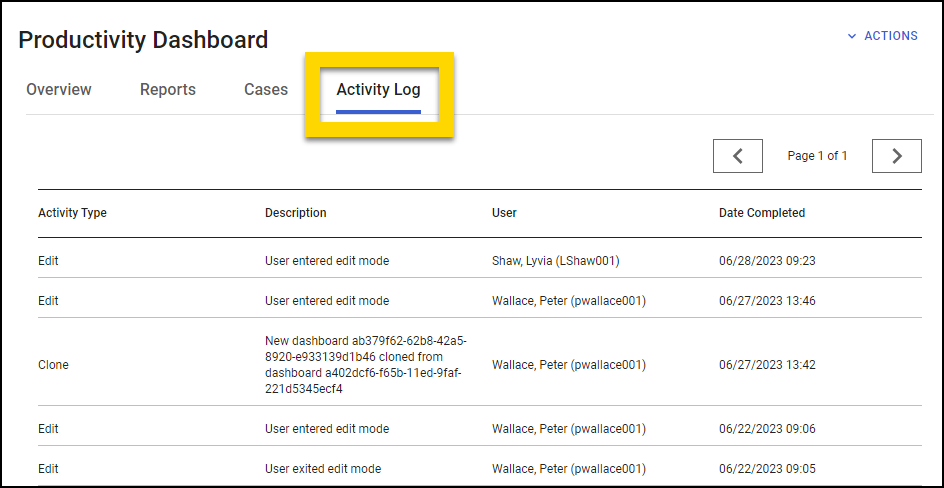
View dashboard activity logs
The Activity Log tab is the last tab on each Analytics dashboard. This tab contains a log of all actions taken on that dashboard, who took the action, and when.