Analytics
Users who have the appropriate privileges can access the Analytics tool in the Administrator Console, which shows all dashboards that have been created.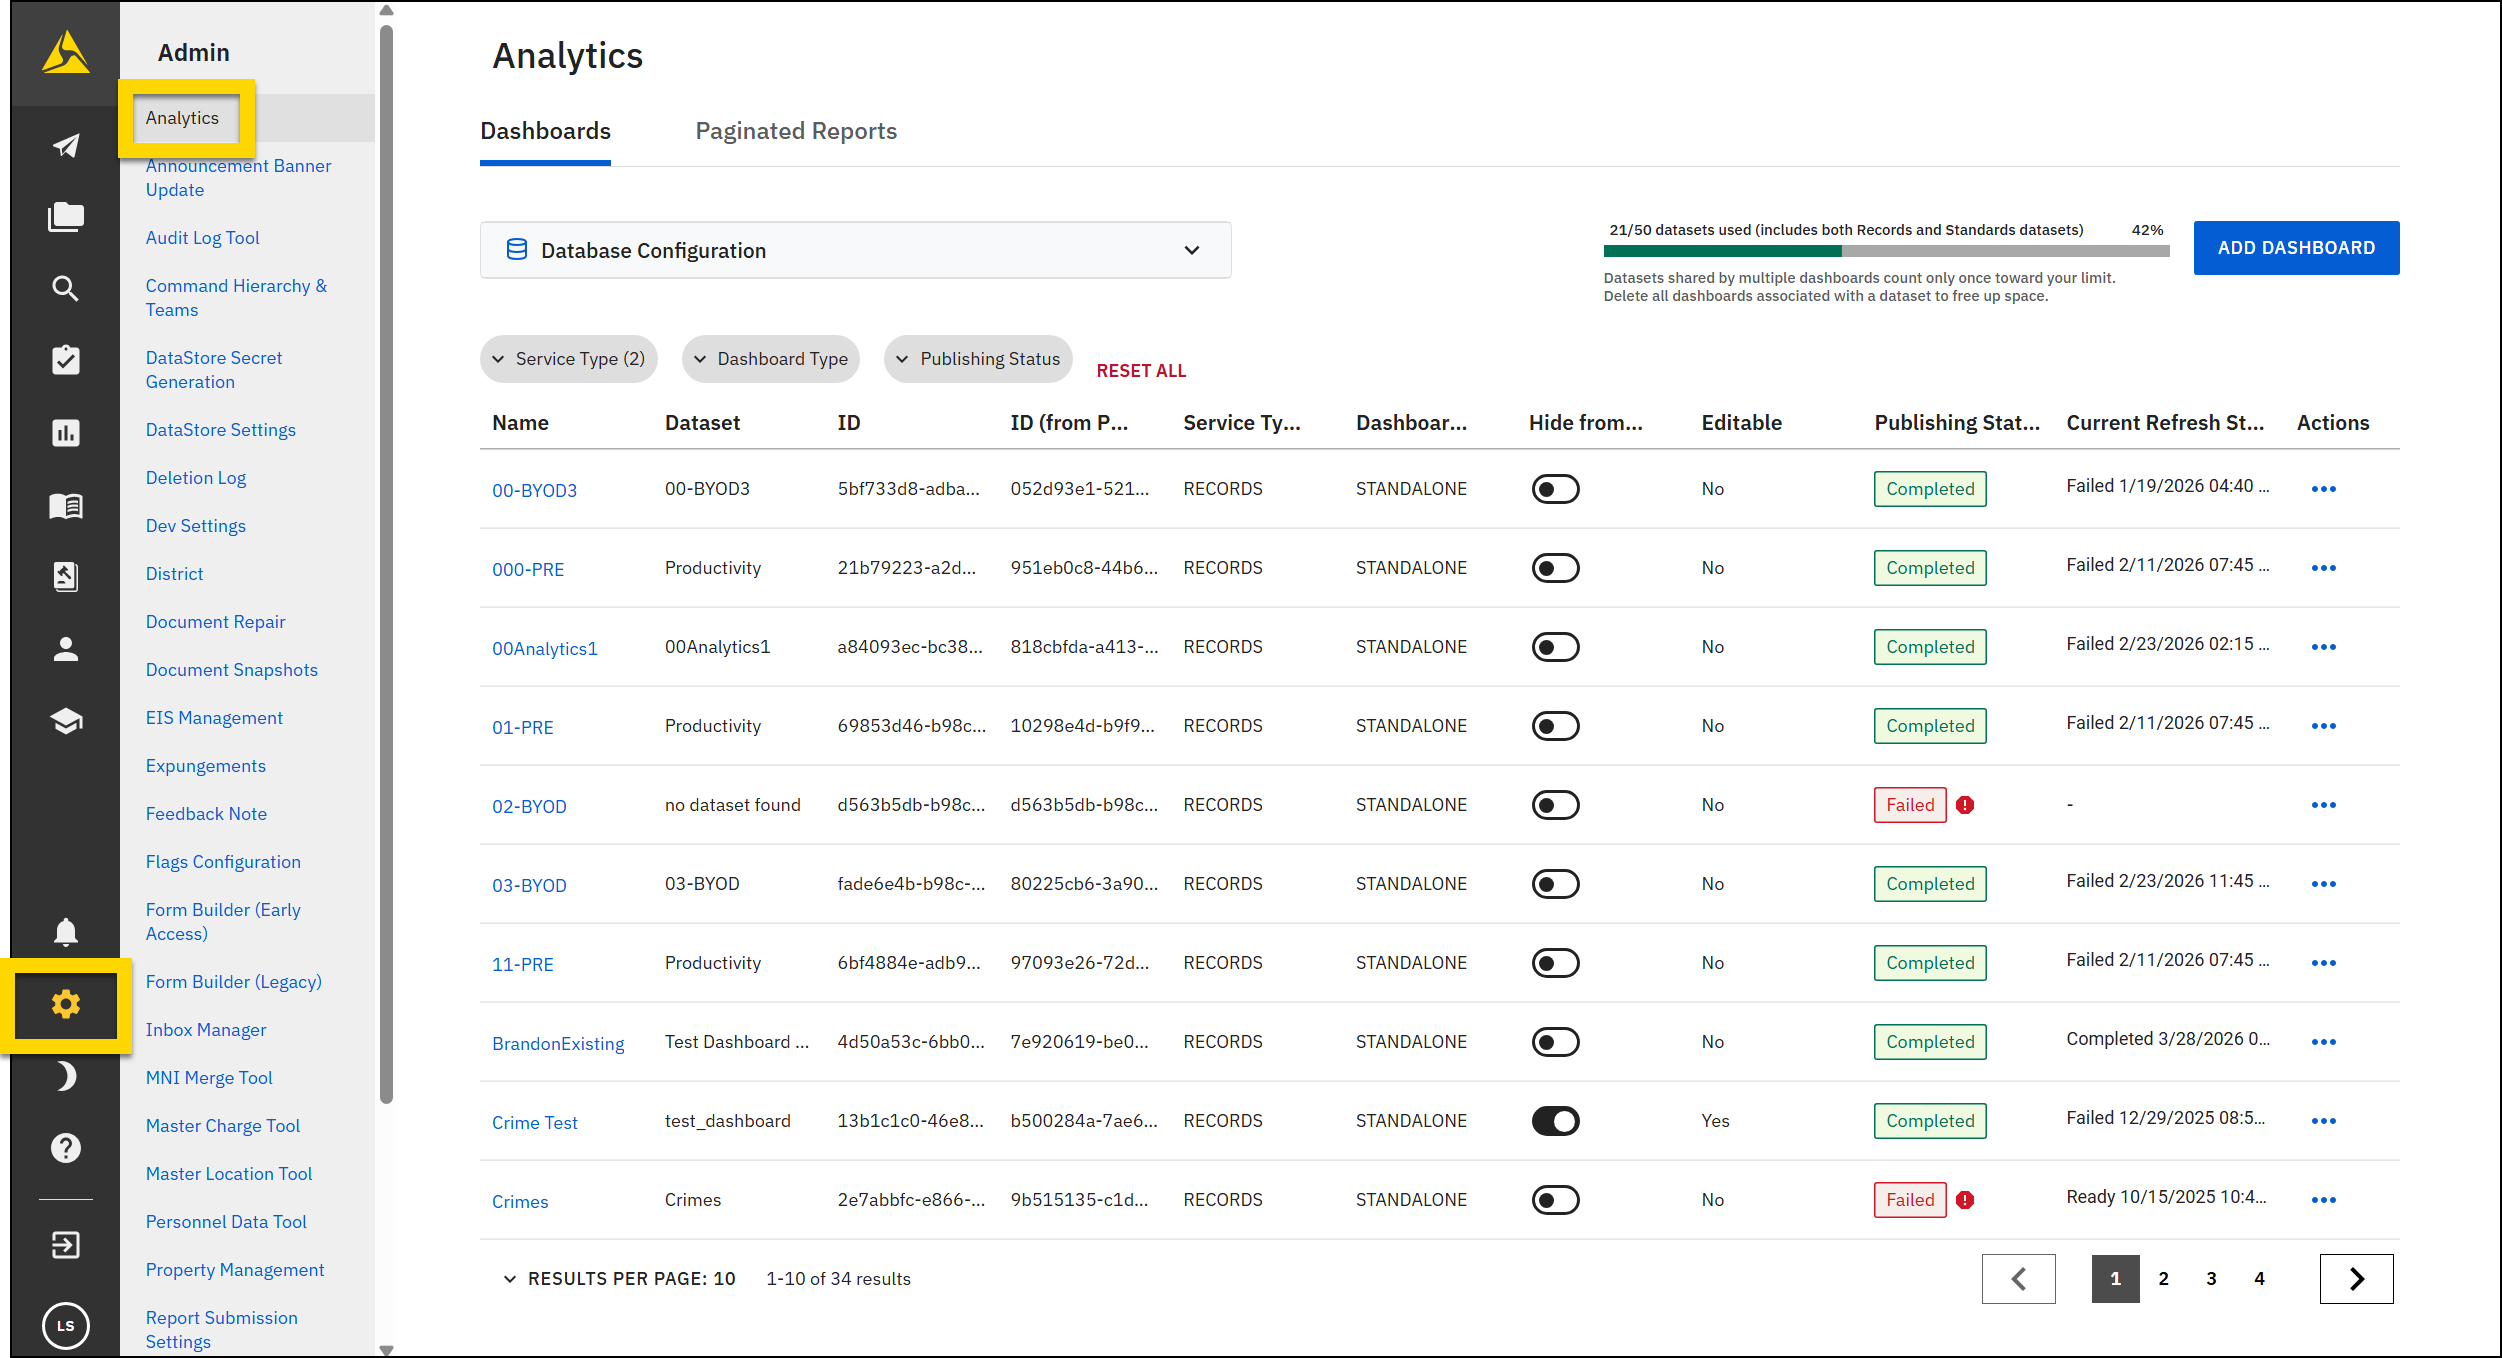
Databases and datasets
The databases that have been configured for your organization appear at the top of the page in the Database Configuration section. Expand this section to view and copy the database and server names for use in SQL queries.
The number of datasets that have been used by your organization's Axon Records and Axon Standards dashboards are displayed beside the Database Configuration section. This information lets you know if you can add additional dashboards using new datasets.
Dashboard list
The main portion of the Analytics tool is the list of dashboards that have been created for your organization. Use the filters above the table to adjust which dashboards appear in the list. Select a column heading to sort the table according to that column. In the table, the following information is included for each dashboard:
- Name: The name of the dashboard that is shown in the Analytics module.
- If this name is updated, the associated privilege name will update to match.
- ID: The Axon Records or Axon Standards ID used to identify the dashboard
- ID (from PBE): The PowerBI ID used to identify the dashboard
- Service Type: If the dashboard is for Axon Records or Axon Standards
- Dashboard's Type: Standalone, Template, or User. See Dashboard types for more information
- Hide from Users: When this toggle is turned on, the dashboard is hidden from the Analytics module. Even if a user has the privilege to view it, they will not be able to.
- Editable: If a dashboard is editable, users can edit it from the Analytics module.
- Publishing Status: The status of dashboards uploaded by Axon representatives.
- The publishing status for User dashboards is Not Applicable.
- Hover over the Failed status to see the failure details.
- Current Refresh Status: The most recently reported refresh status from PowerBI and the date/time of the last refresh.
- Statuses include Ready, Refreshing, Completed, Failed, Disabled, and Unknown (a dashboard was recently uploaded and not refreshed yet, a refresh is in progress, an odd condition occurred).
- If a refresh has failed, hover over the information in this column to view additional details about the failure.
- If a dashboard's refresh status is Completed, but a long time has passed since its last refresh, there may be a problem with the dashboard's refresh schedule. If this occurs, contact your Axon representative.
- Action: Options include:
- Delete dashboard: Permanently deletes the dashboard
- Download dashboard: Lets you download the dashboard's PBIX file
- Download refresh schedule: Lets you download the refresh schedule for that dashboard. To update the refresh schedule, edit the dashboard.
- Download localization file: Lets you download the localization file that contains the localized tab names for that dashboard.
- Refresh dataset: Lets you manually refresh the dataset.
- This manual refresh can only take place if the dashboard status is in no status, Completed, or Railed. If the dashboard status is in Ready or Refreshing, the dataset cannot be manually refreshed.
Dashboard Types
There are three types of Axon dashboards that can be managed by Analytics users: Standalone, Template, and User. Privileges determine which dashboard types a user can manage.
Standalone
Standalone dashboards are PBIX files that are uploaded to the Analytics tool in the Administrator Console by Axon representatives. Axon Analytics comes with a set of out of the box dashboards.
Agency administrators can set whether these dashboards can be edited. If they can be edited, this is done from within the Analytics module, while the user is viewing the dashboard. These standalone dashboards can be deleted from the Analytics tool in the Administrator Console.
Template
Like Standalone dashboards, Template dashboards are uploaded to the Analytics tool in the Administrator Console by Axon representatives. However, unlike Standalone dashboards, Template dashboards can't be edited. Instead, they can be copied, to serve as a starting point for User dashboards.
For more information about building PowerBI dashboards that use data from the Axon DataStore, see Analytics and Power BI.
Like Standalone dashboards, Template dashboards are edited from the Analytics module and deleted from the Analytics tool in the Administrator Console.
A Template dashboard can only be deleted once all User dashboards that were created from it are also deleted.
User
Unlike Standalone and Template dashboards, User dashboards are edited, archived, and deleted from within the Analytics module, not the Analytics tool in the Administrator Console.
Each User dashboard is associated with a set of privileges. You must open the Administrator Console and grant privileges to the Command Hierarchy groups or teams who need to access to these dashboards.
Edit dashboards
To edit a Standalone or Template dashboard, take these steps:
- Open the Analytics tool in the Administrator Console.
- Select the blue dashboard name.
- Update necessary field(s).
- If the name is updated, the associated privilege name will update to match.
- Change whether the dashboard is editable by users or not.
- Select PBIX file to replace the current dashboard file with a new one.
- All privileges associated with the dashboard remain unchanged.
- Select Refresh schedule to upload a JSON file that outlines how often the dashboard should refresh (pull data from the DataStore and display it on the dashboard).
- Download this example JSON file and update the days and times for the dashboard.
- Refreshes generally should occur every few hours, although they can occur more or less frequently. The smallest refresh interval allowed is once per hour.
- If your organization has multiple dashboards, it’s helpful to stagger the refresh schedule for each dashboard to prevent refresh errors and delays. For example:
- Dashboard A: Refreshes every three hours, on the 15-minute mark (1:15, 4:15, 7:15, etc.)
- Dashboard B: Refreshes every four hours, on the 30-minute mark (1:30, 5:30, 9:30, etc.)
- Select Confirm.
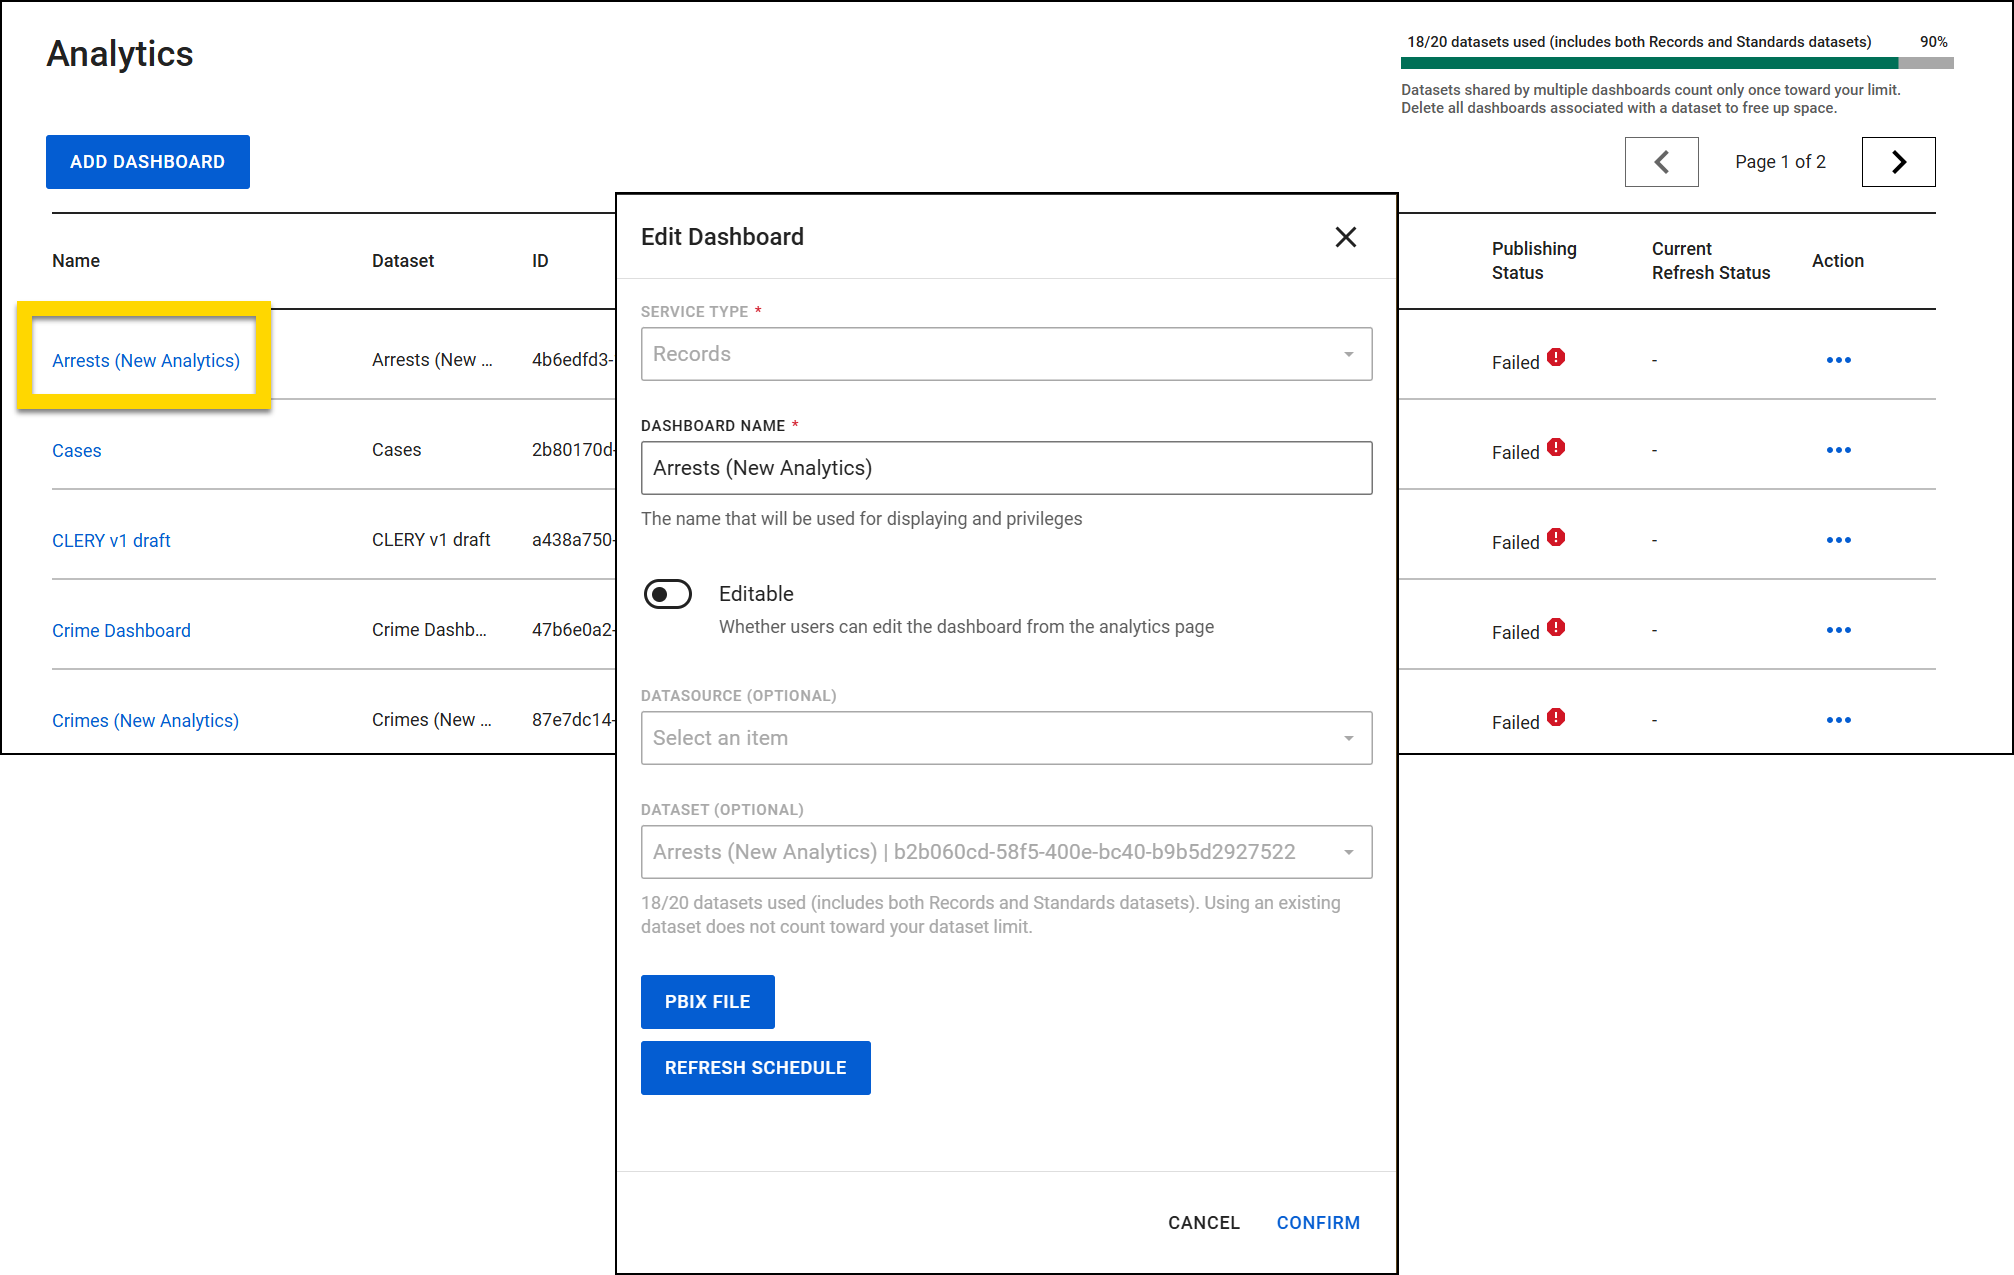
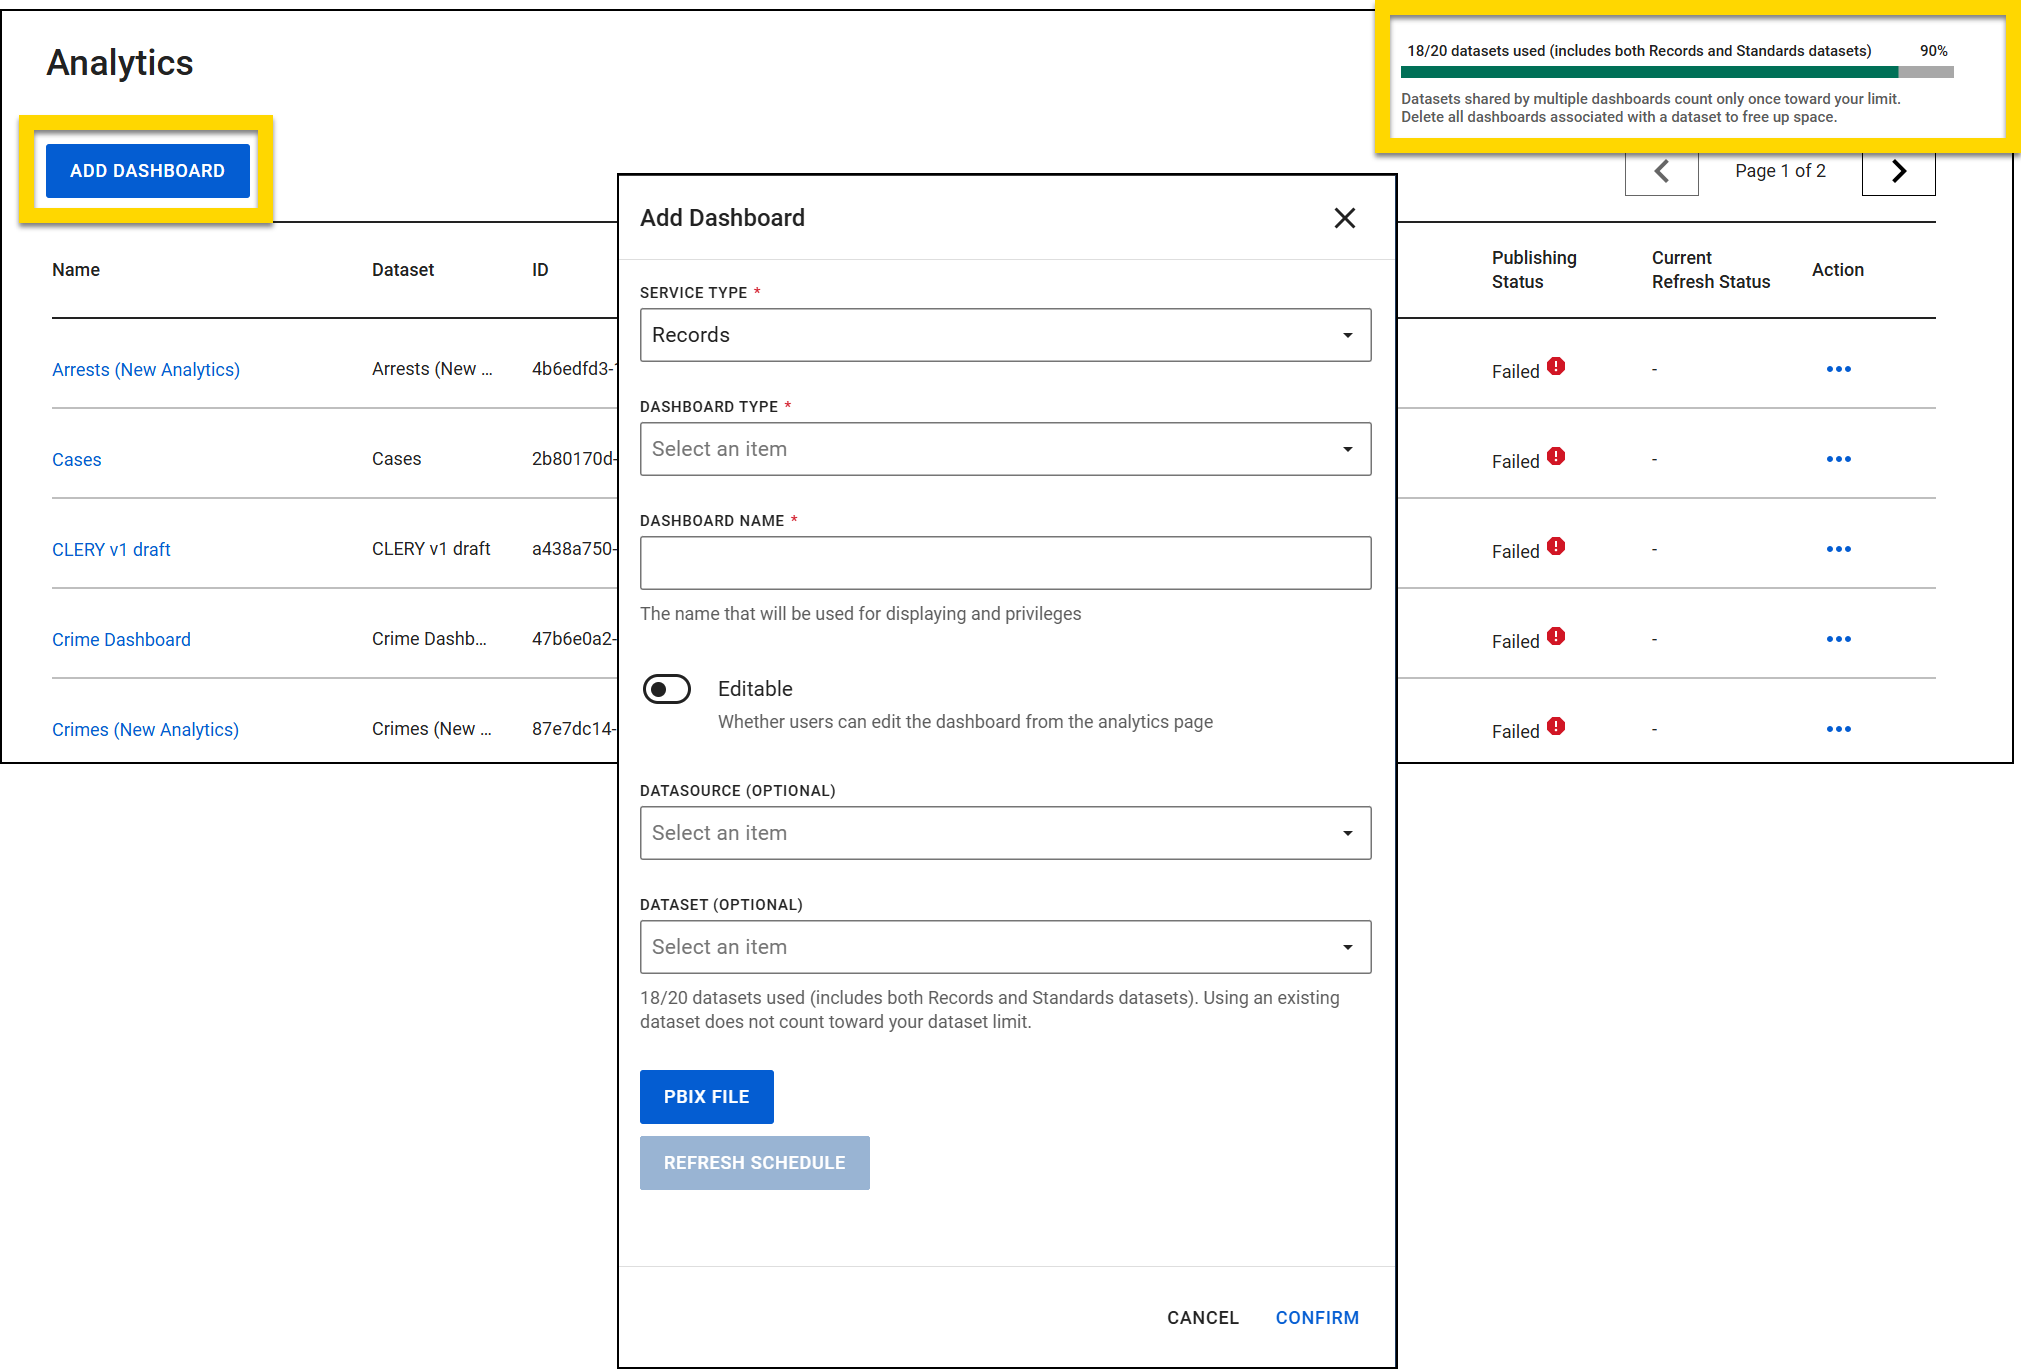
Add dashboards
Users with the appropriate permissions can upload a Power BI dashboard to the Analytics tool as long as they have not already reached their dataset limit. This limit is displayed in the top right corner of the Analytics tool. If you want to create a dashboard but have already reached your dataset limit, you must delete all dashboards associated with a dataset to free up space.
The only dashboards that can be uploaded are those that connect to the Axon DataStore. Dashboards connected to other data sources are not supported.
To add a dashboard:
- Open the Analytics tool in the Administrator Console.
- Select Add dashboard.
- Select a Service Type (Records or Standards).
- Select a Dashboard Type (Standalone or Template).
- Enter a name for the dashboard
- This name appears in the Analytics module, as well as in Analytics privileges.
- Set whether or not the dashboard can be edited by users who access the dashboard in the Analytics module.
- Optionally provide a datasource or dataset.
- Select PBIX file to add the dashboard files from your computer.
- See the error list for potential errors you may receive and the steps that can be taken to resolve them.
- Select Refresh schedule to upload a JSON file that outlines how often the dashboard should refresh (pull data from the DataStore and display it on the dashboard).
- Download this example JSON file and update the days and times for the dashboard.
- Refreshes generally should occur every few hours, although they can occur more or less frequently. The smallest refresh interval allowed is once per hour.
- If your organization has multiple dashboards, it’s helpful to stagger the refresh schedule for each dashboard to prevent refresh errors and delays. For example:
- Dashboard A: Refreshes every three hours, on the 15-minute mark (1:15, 4:15, 7:15, etc.)
- Dashboard B: Refreshes every four hours, on the 30-minute mark (1:30, 5:30, 9:30, etc.)
- Select Confirm.
Dashboard errors
You may receive one or more of the following errors when uploading a dashboard:
| Error | Resolution |
|---|---|
| Table Partition mode must be import
This error indicates that the dashboard uses direct query, or any other import mode for a table in the data model other than import. |
Ensure the tables only use import mode. |
| Source expression must contain SELECT statement with defined columns or Table.SelectColumns
This error indicates that one or more queries in the dataset do not specify columns. |
Remove any select * type operations.Ensure all queries are objective. |
| Source column must not contain raw data
One or more queries in the dataset includes a raw data column, which tends to be too slow and cause problems during data refreshes. |
Remove any raw data columns. These columns typically can be identified by a _raw_data suffix. |
| Themes do not match Number of sections do not match Section names do not match Section display names do not match Number of visual containers do not match Queries do not match |
These errors indicate a mismatch between the PBIX and PBIT files, which may indicate that the files are not the same, or that they were saved/exported at different times. To resolve these issues, re-save the PBIX file and re-export the Power BI template (PBIT) file. See the Power BI help documentation for more information. |