Analytics
The Axon Analytics dashboards, accessed by selecting the data icon in the main navigation menu, let you take a closer look at the data being generated by your organization. A set of out of the box dashboards can be used and configured for your organization to help you make informed decisions.
You can interact with the various visuals in the dashboards as well as export them into various formats for sharing. Users with specific privileges can create, edit, and delete these dashboards.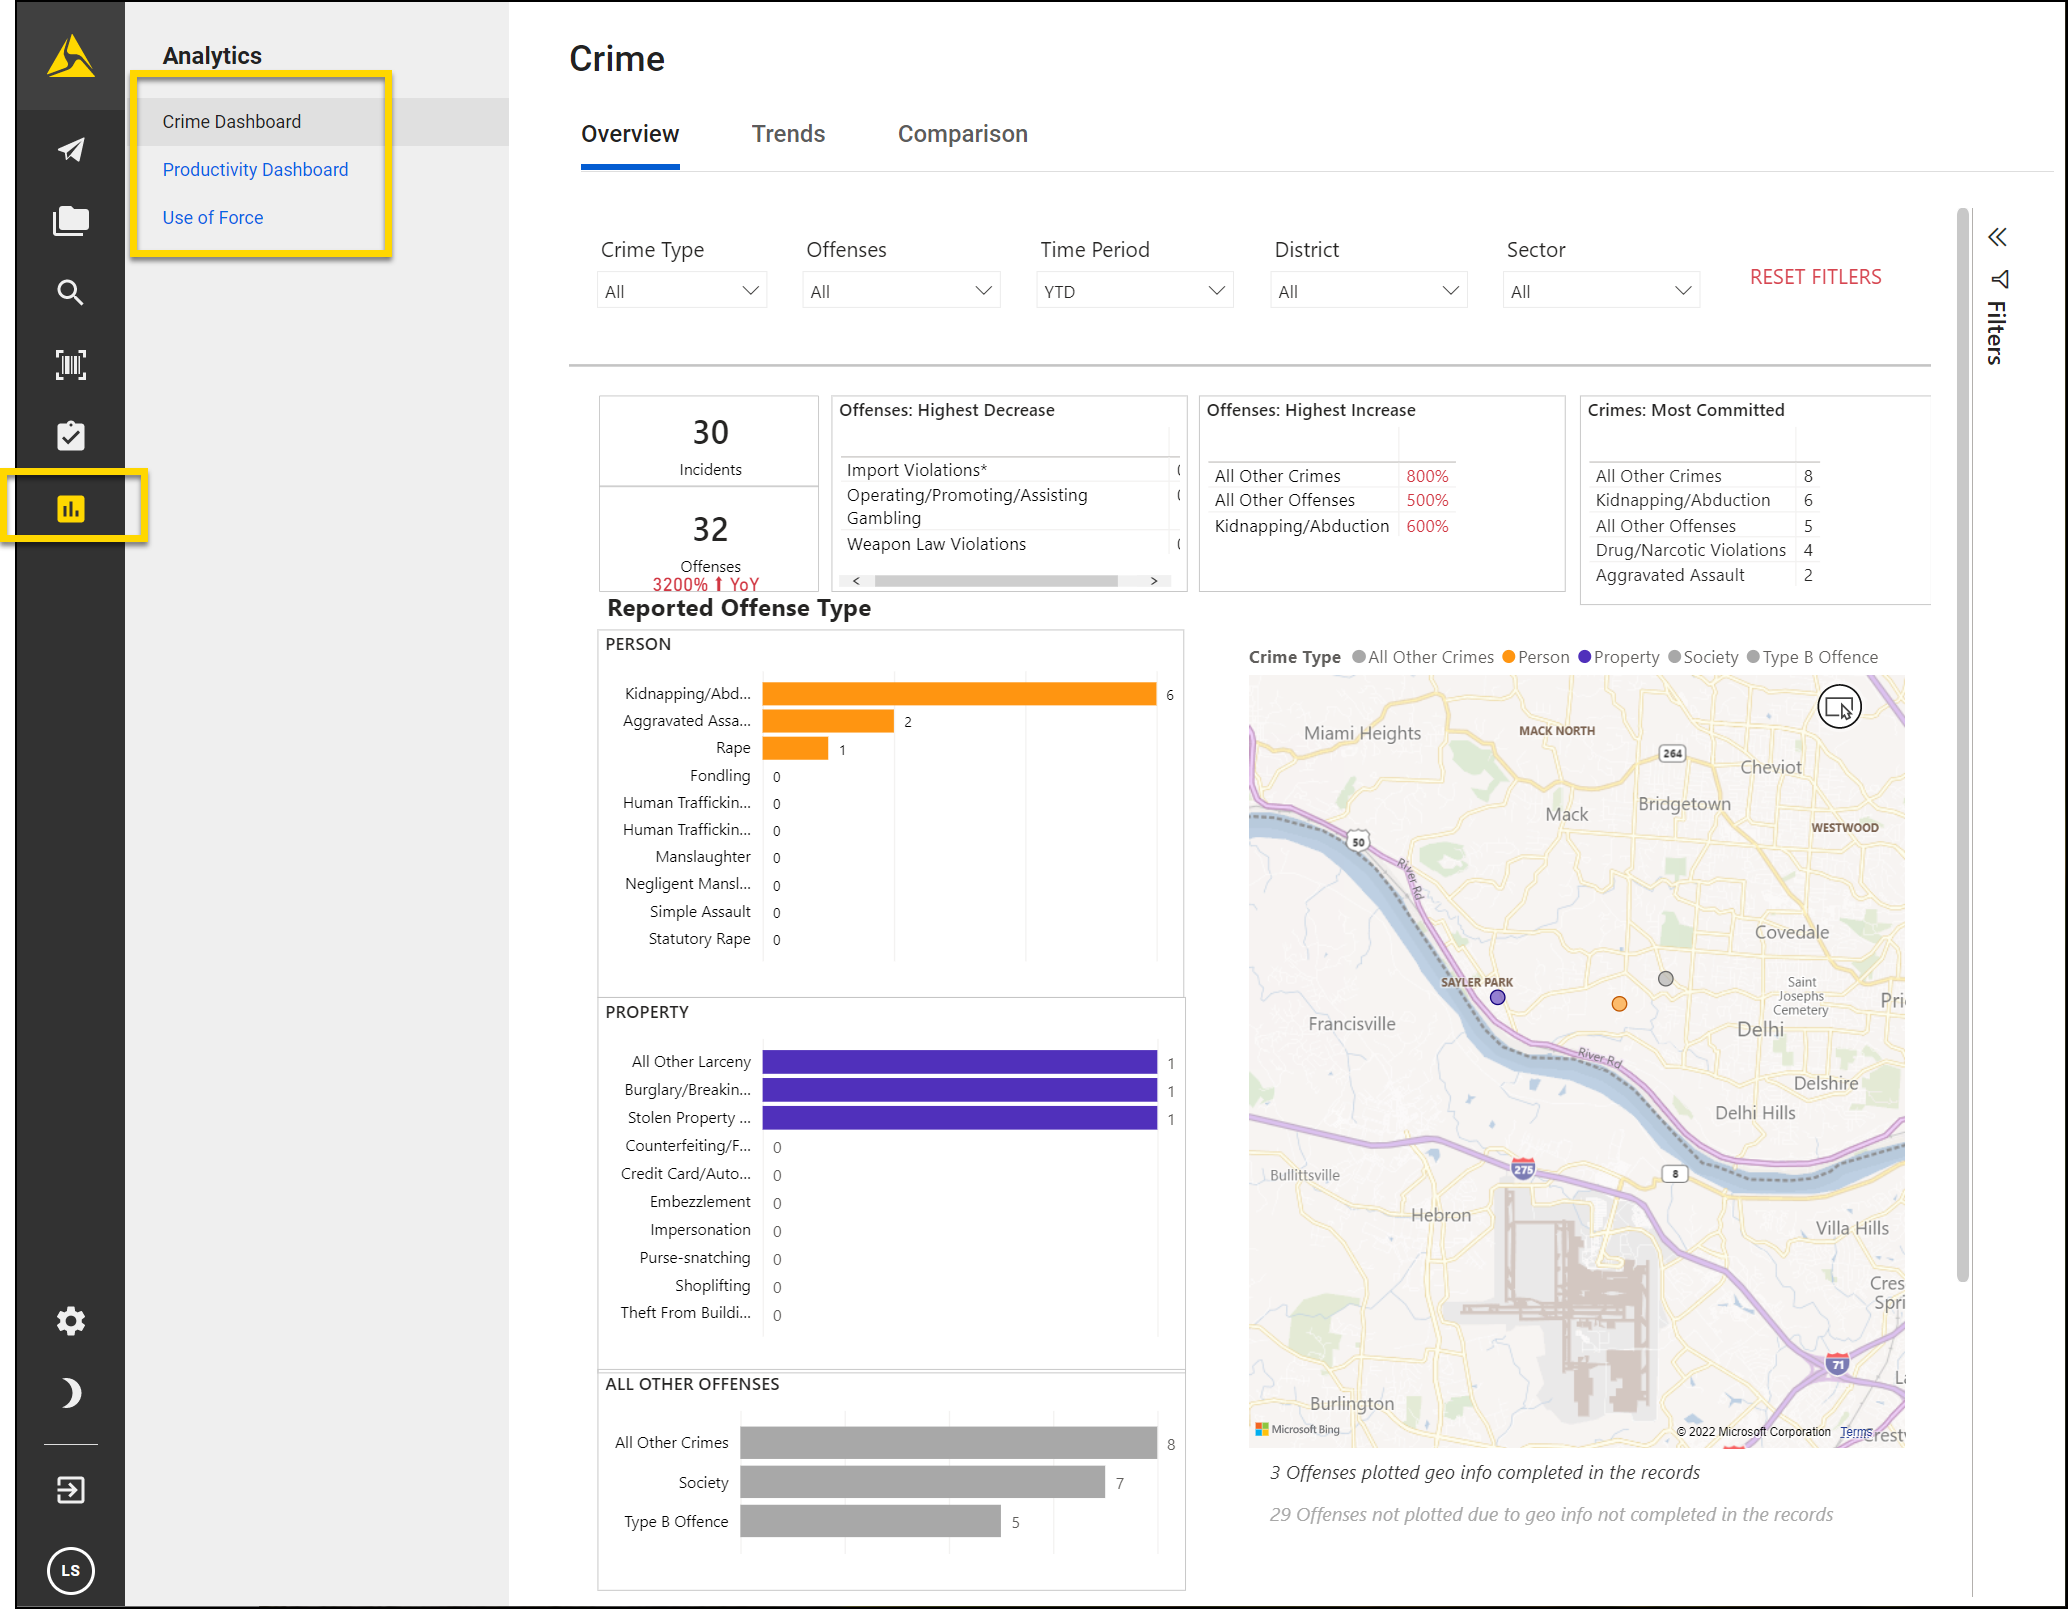
Out of the box dashboards
When your organization begins using the Analytics module, you can access a set of Out of the box (OOTB) dashboards. Contact your Axon representative or Axon Support if you want to adjust these dashboards.
A file containing example downloads of all OOTB dashboards can be found here.
The following dashboards are available in Axon Records:
- Arrest
- Case Management
- Citations
- Crimes
- MNI De-Duplication
- Report Productivity
- Property/Evidence Management
- Stolen Property Recovery
- Stolen Vehicle Recovery
Arrest
The Arrest dashboard shows arrest activity, demographics, and trends, including total arrests, charge types and severity, arrest locations, arrestee profiles, and time-based patterns. This dashboard contains the following tabs:
- Arrest overview: Provides a comprehensive overview of arrest activity including total arrests and charges, types of charges and their distribution, geographic mapping of arrest locations, and categorization by arrest type and charge severity. Also includes detailed tables of individual arrests with dates, locations, arrestees, charges, and officers involved.
- Arrestee demographics: Offers insights into the demographic characteristics of arrestees such as age distribution with an average of years, sex and racial breakdown emphasizing majority males and white non-Hispanic individuals, number of juveniles arrested, armed status at arrest, and identification of repeat offenders. Detailed profiles of each arrestee support this analysis.
- Arrest trends: Analyzes patterns and trends of arrests over time by month, day of week, and time of day showing peak periods.
Case Management
The Case Management dashboard shows case activity, highlighting totals, statuses, closure rates, overdue trends, and investigative unit performance with detailed insights into case timelines, dispositions, and cleared-by-arrest outcomes. This dashboard contains the following tabs:
- Cases overview: Provides a snapshot of all cases including triage, active, and closed cases as of the latest data refresh. Displays completion rates, cleared-by-arrest rates, overdue rates, and average days to close cases. Includes monthly and yearly trends of cases created and provides breakdown by investigative units with tabular detail of case numbers, detectives, offenses, statuses, and dispositions.
- Overdue cases: Focuses on cases that are past their due dates, showing active and overdue case counts and overdue rates. Includes monthly/yearly overdue trends with distinctions for cases overdue over 30 and 90 days. Details overdue cases by investigative unit with overdue rate percentages and provides a table of cases assigned with key due date information and days overdue.
- Closed cases: Summarizes cases that have been closed, presenting total closed cases, number of closed cases with arrests, cleared-by-arrest rates, and average days to close. Displays temporal trends by month and year for case closures. Visualizes closed cases by internal reason and disposition categories and tabulates closed case details by investigative unit and specific.
Citations
The Citations dashboard includes multiple filters for querying citation data by various fields such as report number, subject role, officer, vehicle details, and demographics
It provides summary metrics on the total number of citation reports and people involved, followed by visualizations showing citations by violation type, geographic distribution, and citation trends over time. Additional sections analyze citations issued by officers and demographic breakdowns of subjects by sex, race, and age. The dashboard concludes with a detailed table listing individual citation records, including offense details, officer information, and subject demographics, supporting thorough review and analysis of citation activity.
Crimes
The Crime dashboard provides actionable insights into crime patterns, aiding in analysis and decision-making. It shows a comprehensive view of crime activity, including overall incident summaries, detailed analyses of crimes against persons and property, time-based and geographic trends, and comparisons across multiple reporting periods. This dashboard contains the following tabs:
- Crime overview: Presents an overall summary of total incidents and offenses, categorizing them into crimes against persons, property, and society, alongside a geographic map showcasing incident locations and a detailed list of individual incidents by date, address, district, and offense type.
- Crimes against persons: Focuses specifically on crimes against persons, offering counts of incidents and victims, detailed breakdowns by offense types such as assault and murder, trends of victim counts over quarters and years, and a corresponding map of incident locations.
- Property crimes: Property crimes are highlighted with incident and offense counts broken down into specific types like burglary and robbery; a geographic distribution map and temporal trends by month and year are also included, complemented by incident details featuring stolen firearm counts.
- Crime comparison: Compares crime statistics across different time frames—7 days, 28 days, and year-to-date—showing offense counts, percentage changes, and notable trends across various crime categories, helping to identify shifts in crime patterns.
- Crime trends: Offers a detailed crime trends summary with offense distribution by description, district-level counts, a heatmap illustrating crime occurrence by time of day and day of week, and a list of incidents with comprehensive details.
MNI De-Duplication
The MNI De-Duplication dashboard can be accessed from the Administrator Console. This dashboard provides an overview of Master Name Index (MNI) statistics, highlighting unique and merged records, potential duplicates based on identifier combinations, and MNI associations with incidents. This dashboard contains the following tabs:
- MNI summary statistics: Overview of key MNI statistics including counts for Unique MNIs (96), Unique Canonical MNIs (94), and Merged MNI Records (2). Includes percentages and counts of possible duplicate MNIs identified based on different unique identifier combinations such as First Name Soundex with DOB and full name with DOB.
- Possible duplicate MNIs by identifier combinations: Detailed lists of possible duplicate MNIs identified by specific unique identifier combinations: First Name Soundex and DOB, First Name, Last Name and DOB, and Last Name, First Name Soundex and DOB. Each combination section provides counts, related canonical MNIs, and examples of identifier values suspected of duplication.
- Master Name Index records by incident: Tabular listing of MNI records associated with incidents. Shows key personal attributes like canonical MNI, full name, date of birth, age, sex, race, ethnicity, OLN, SSN, person type, and soundex values to aid in validating identity records against incidents in the system.
See Use the MNI Merge Tool from the Administrator Console for more information about using this dashboard to merge duplicate MNI records.
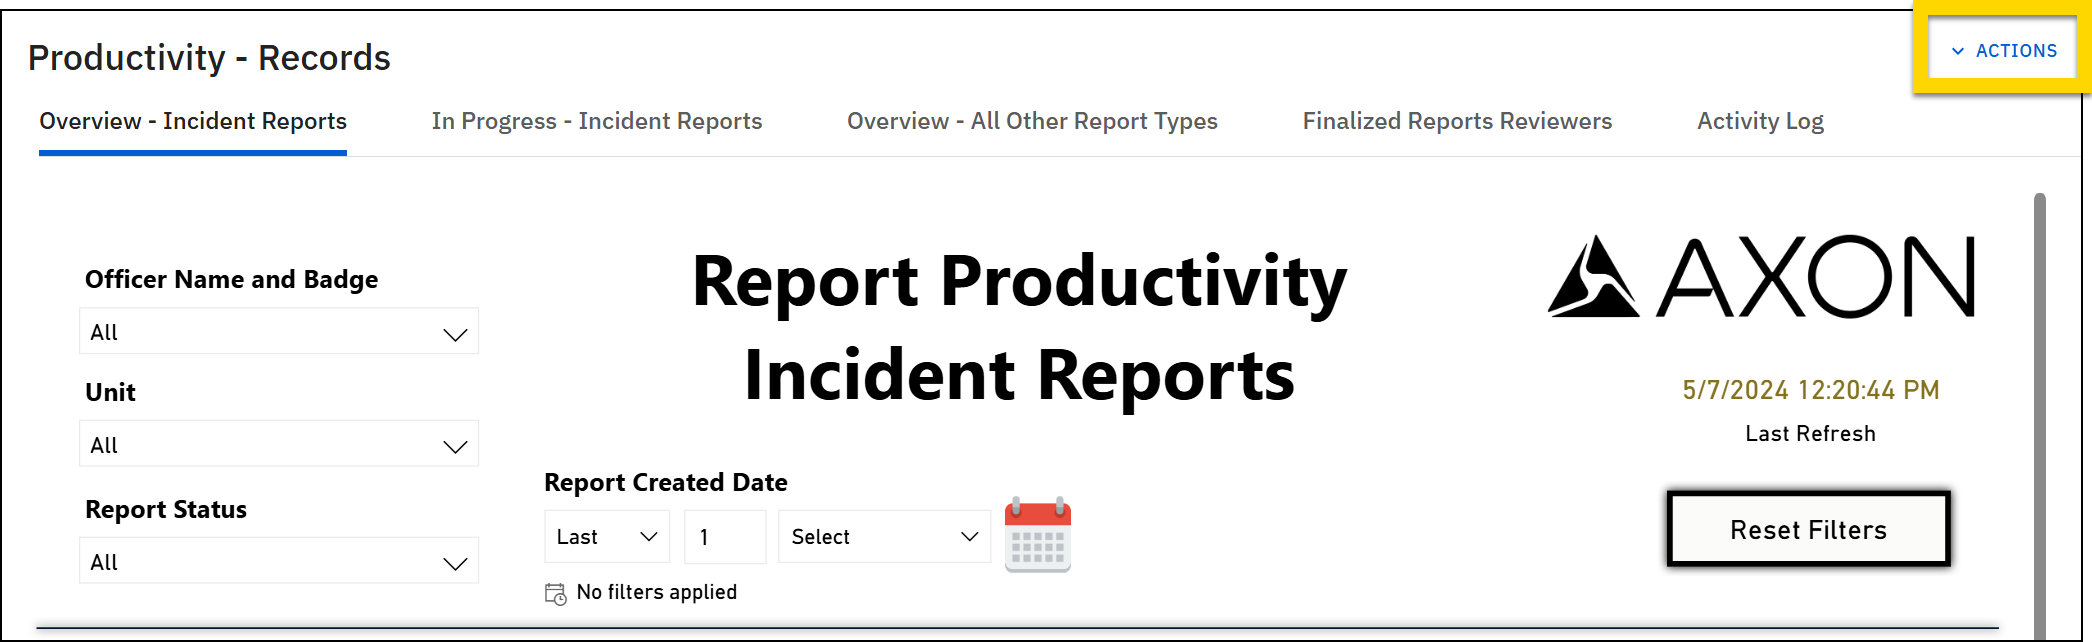
Report Productivity
The Productivity Reports dashboard provides insights into report creation and management activity across various report types, tracking contributions, progress, and review outcomes to measure overall reporting efficiency. This dashboard contains the following tabs:
- Incident reports productivity: Provides an overview of incident report contributions including counts of drafts, reports under supervisor review, finalized contributions, and total contributions. Displays trend analysis by year and month and contribution volumes by officer’s current unit. Includes tabular detail of reports with metadata such as author, status, and assignments.
- In progress contributions: Details reports currently in progress, encompassing draft and supervisor review stages. Provides counts by unit and a cumulative total. Also includes a detailed table listing individual reports with statuses, days in status, and current assignee for close management and tracking.
- Other reports productivity: Summarizes productivity data for all other report types beyond incidents including draft status, supervisor review, and finalized reports. Presents monthly and yearly trends, breakout by report type, and contributions by primary assignee unit, along with detailed report listings.
- Finalized reports: Focuses on reports that have been finalized showing counts by those finalized in supervisor and records review. Lists top reviewers by volume and provides details on finalized reports including workflow, creation and finalization dates, call types, and days taken to finalize.
- Rejected contributions: Examines contributions that have been rejected including total rejected counts and rejection rate percentage. Provides breakdown by officer and supervisor responsible for rejection. Contains a list of rejected contributions showing report numbers, authors, units, and counts of times rejected for transparency and follow-up.
Property/Evidence Management
The Property/Evidence Management dashboard provides visibility into all property and evidence items, their custody status, retention timelines, and audit activity to support accountability and compliance. This dashboard contains the following tabs:
- Not submitted & pre check property & evidence: Highlights items not submitted or in pre-check status with bar chart and detailed item listing.
- Property & evidence – All items in police custody: Overview of all items held in custody, including counts, value, charts by location and status, and detailed list.
- Items with expiring or expired retention dates: Displays items with retention dates expiring or expired, filters, and detailed list including responsible party.
- Items permanently removed from police custody: Lists items permanently removed via auction, destruction, donation, release, or return.
- Property audit list: Lists items selected for audit with options and detailed item listing.
Stolen Property Recovery
The Stolen Property Recovery dashboard provides insights into stolen property incidents, recovery rates, and related trends. It combines geospatial analysis, detailed listings, and statistical summaries to support recovery tracking and operational awareness. This dashboard contains the following tabs:
- Stolen property recovery overview: Provides a comprehensive overview of stolen property incidents and recovery status for the selected timeframe. Displays key metrics including counts of stolen, recovered, and not recovered items along with the overall recovery rate. Includes geospatial visualization of stolen and recovered property locations and detailed tables segmented by offense and recovery locations, property types, and descriptions. Filtering options allow deep dives into district, offense, and property specifics.
- Stolen property hot sheet: Lists detailed incident-level data on stolen properties including property number, type, description, monetary value, and serial number, with their current recovery status. This sheet supports real-time monitoring with date filters and allows users to quickly identify recent thefts and recovery cases by offense and location, aiding rapid response efforts.
- Stolen property stat sheet: Summarizes statistical insights on stolen and recovered property including counts and monetary values across different property types and locations. Users can filter and analyze data by offense description, UCR disposition, district, and firearm type, offering a high-level view of trends and recovery efficiency throughout the specified period.
Stolen Vehicle Recovery
The Stolen Vehicle Recovery dashboard provides an overview of vehicle theft and recovery activity. It combines geographic, statistical, and incident-level data to monitor trends, recovery performance, and vehicle-specific patterns. This dashboard contains the following tabs:
- Stolen vehicle recovery overview: Provides an overall status of stolen and recovered vehicles including current counts and recovery rates. Displays geographic data mapping locations of both thefts and recoveries and lists top offense and recovery locations by block address. Details vehicle makes involved in thefts and allows filtering by various criteria.
- Stolen vehicle recovery hot sheet: Lists detailed information on stolen vehicles and their recovery status, including incident numbers, vehicle identification like make, model, color, year, license plate, and VIN. Includes filters for time range and location to monitor recent thefts and recoveries in near real-time.
- Stolen vehicle stat sheet: Displays statistical data summarizing stolen vehicle makes by month and other key factors such as vehicle type, offense description, and disposition. Enables filtering by various vehicle and incident attributes to track trends and patterns over the year.
General functionality
You can interact with Analytics dashboards in various ways, including:
- Actions
- Tabs
- Filters
- Tooltips
- Focus Mode
- Right-click
- Maps
Watch this video for an explanation of the content contained in the following sections.
Actions
Each dashboard contains an Actions menu you can open to:
- Create new dashboard:Create a new copy of the dashboard to edit and customize as desired.
- Edit dashboard: Edit the title, tabs, and visualizations for the dashboard.
- Create bookmark: Save a link to the page, including whatever filters you have set in your current session.
- Export dashboard: Export the dashboard as a PDF, CSV, or PPTX (Power Point) file.
Tabs
Each dashboard opens to an Overview tab. Select the names that appear to the right of the Overview tab to switch to tabs that contain different charts and data.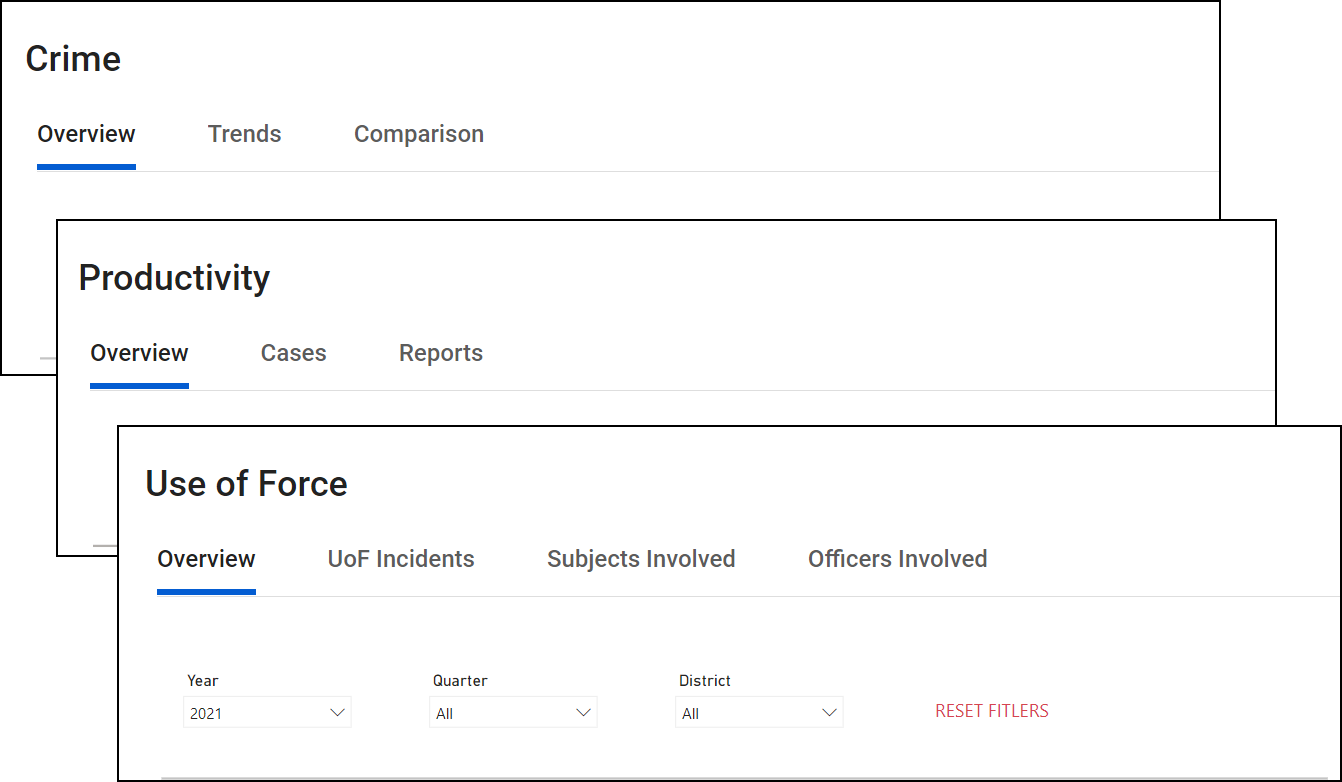
Filters
Use two different types of filters to adjust the data displayed in the dashboards:
- Choose from the drop-down filters at the top of the window
- Select a piece of data or chart section
Drop-down filters
Each dashboard has a different set of filters to choose from that allow you to refine the data that is displayed.
Hover over a filter and select the eraser icon to remove filters from that menu. Select Reset filters to remove all filters from all menus.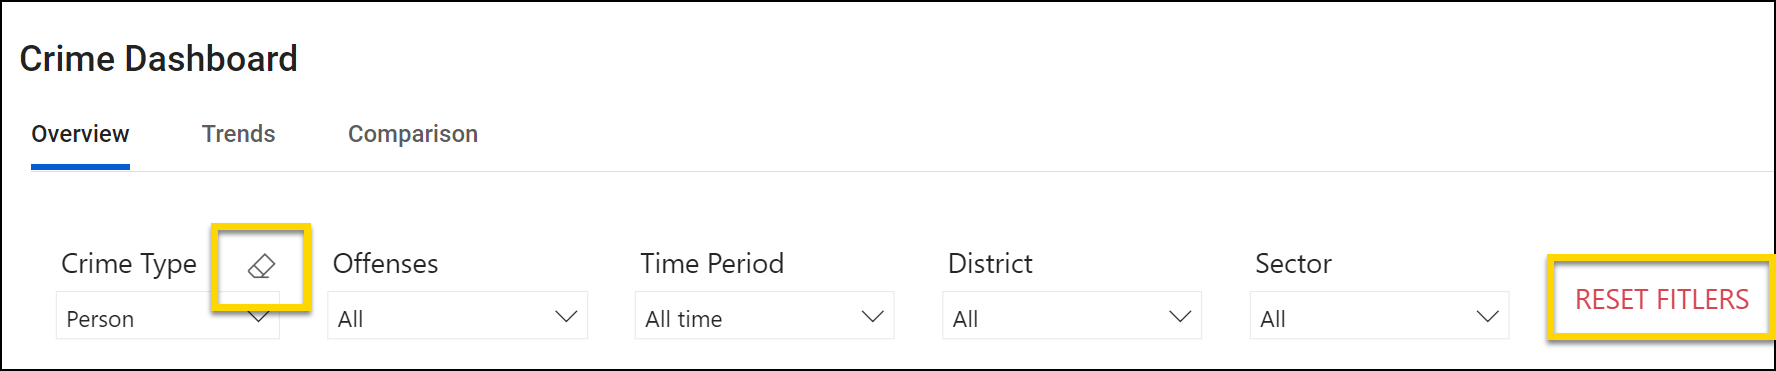
Chart filters
All visuals on a dashboard are connected. This means that if you select a piece of data or colored section of a chart, all data on the dashboard is filtered by that criteria.
For example, selecting one of the districts on the Use of Force Overview tab filters all charts to show data for just that district. The area that you selected will remain a dark color and all other districts will appear washed-out.
To remove the filter, select the data or chart section again or select Reset filters at the top of the window.
See Power BI's help documentation for additional details about filtering.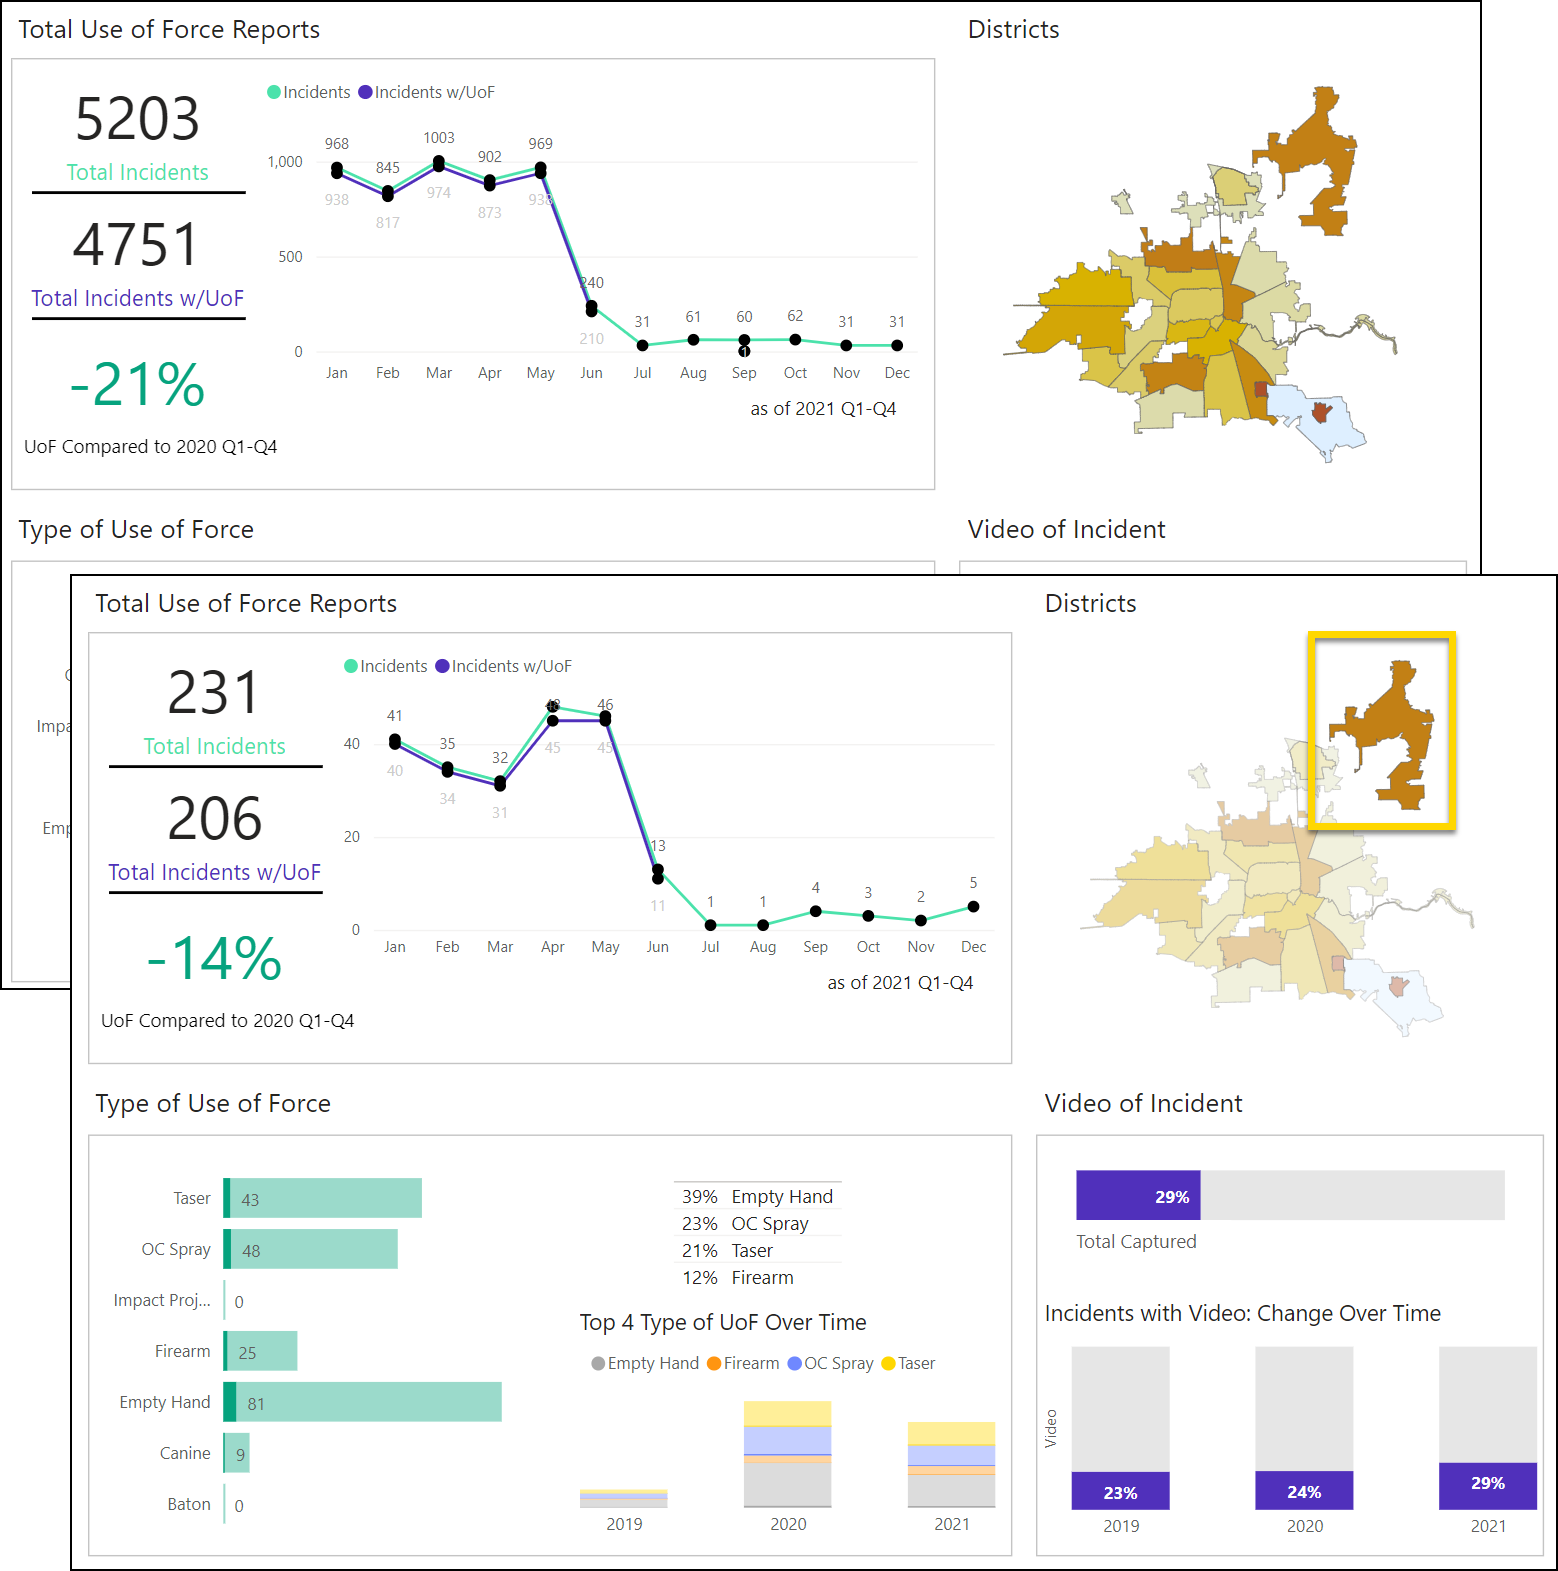
Tooltips
Hover over a section of a chart to reveal additional data: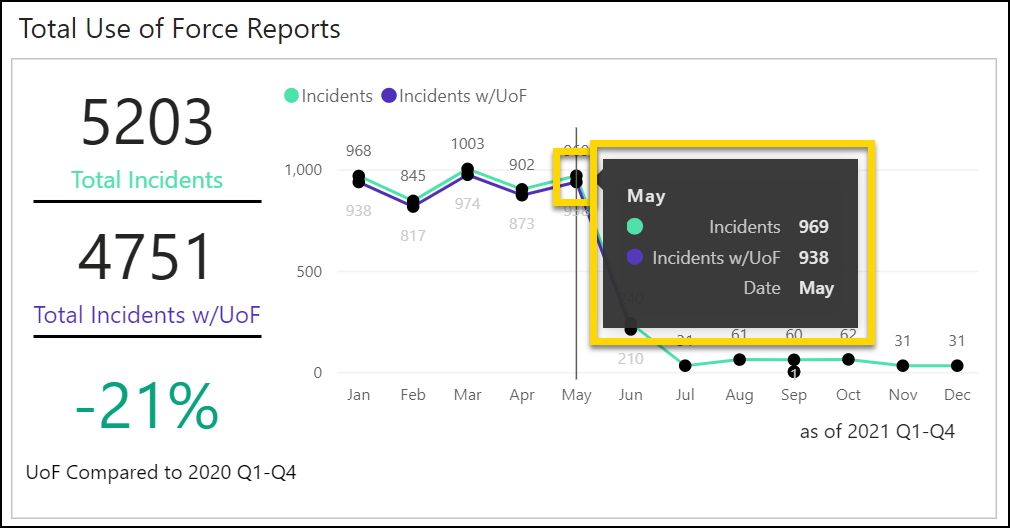
Focus Mode
Click on any chart to enter Power BI's Focus Mode and reveal additional options above the chart. Use these options to:
- Drill up or down
- View the filters that impact the visualization
- Spotlight the visualization
- Open Focus Mode, which reveals a larger version of the visualization
- Export the data for just that visualization
- Adjust the sorting axis or sort order
See Power BI's help documentation for additional information about Focus Mode.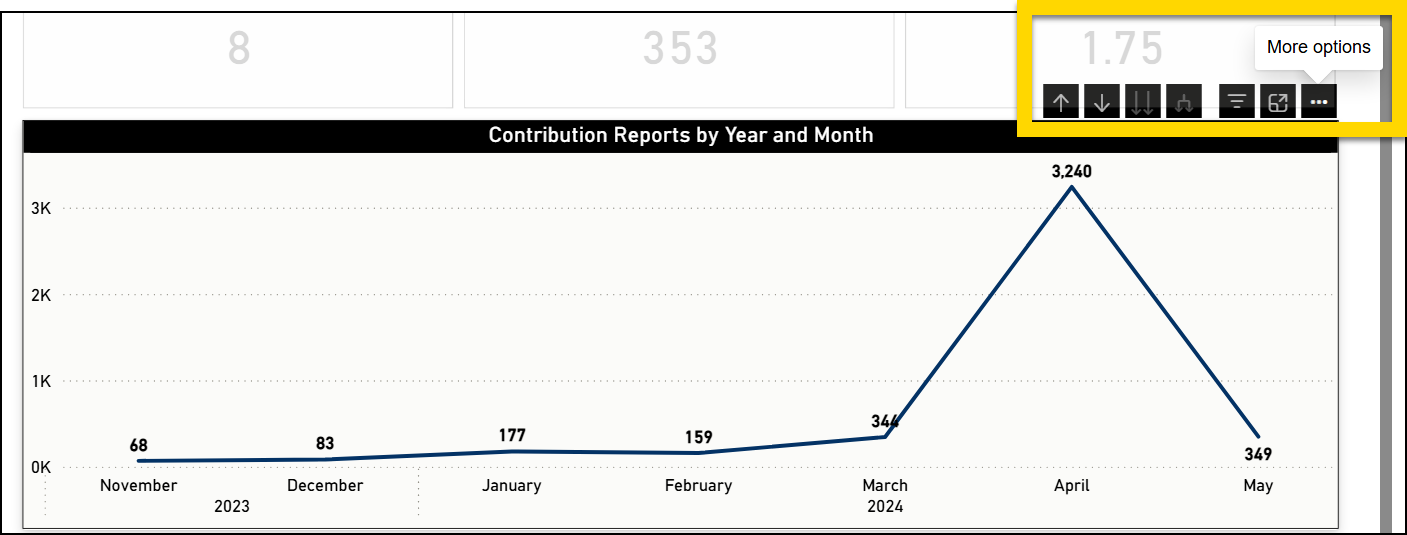
Right-click
Right-click on any chart to reveal additional drill-down options, including:
See Power BI's help documentation for additional information about drill-downs.
Show as table
Selecting this option reveals a larger version of the visualization, as well as a table version of all data. The Focus Mode options appear above the visualization. Select Back to report to return to the tab you were viewing.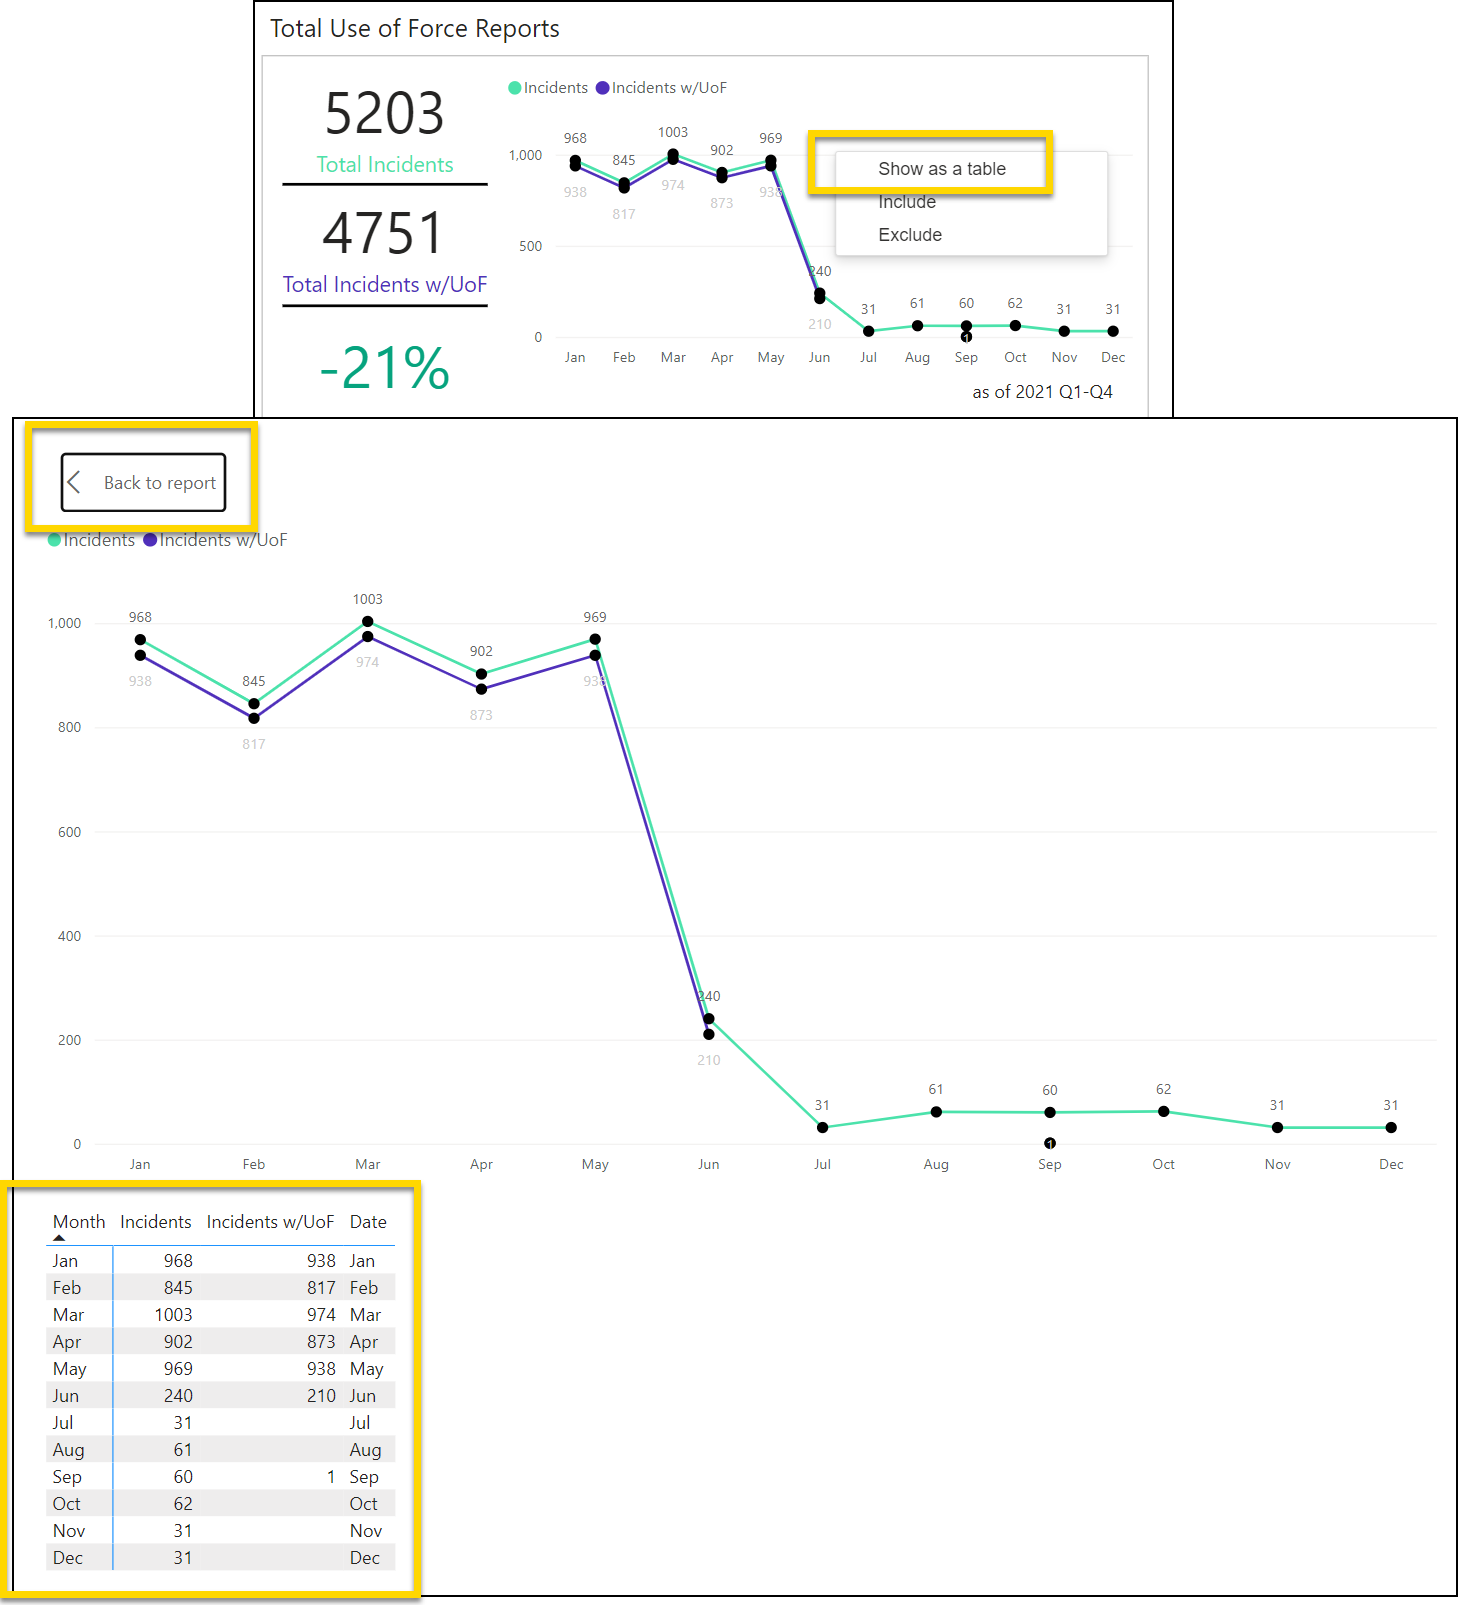
Include / exclude
If you want to include or exclude a piece of data from the displayed results, right-click on the piece of data / chart section and select Include or Exclude.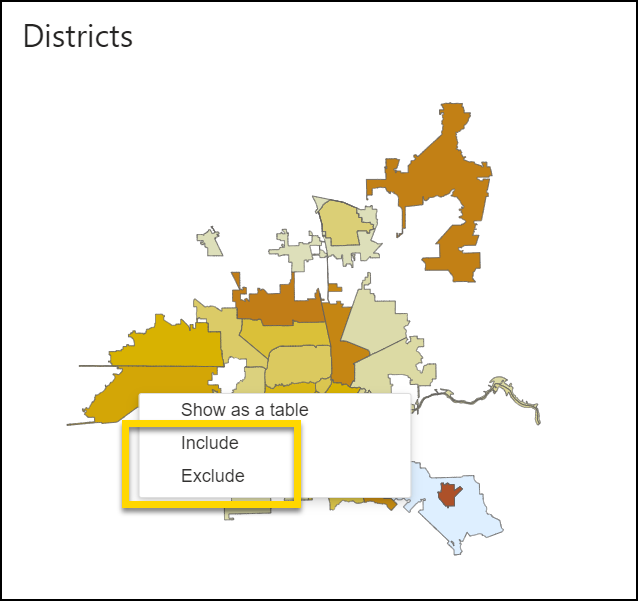
Copy
Right-clicking data that is presented in a table on the main dashboard tab reveals two copy options:
- Copy value: Copies the value of that cell. If the cell contains a percent, it will be converted to the decimal value.
- Copy selection: Copies the entire row. Unlike Copy value, percentages are not converted into decimals
After copying a value or selection, you can paste the data into another program or document by pressing CTRL + V (Windows) or CMD + V (Apple) on your keyboard.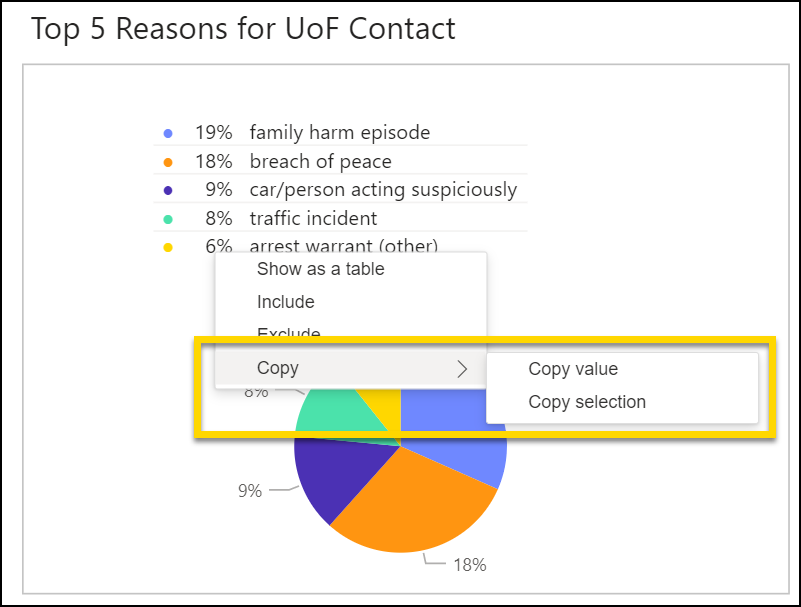
Maps
Several dashboards contain maps. Click and drag to adjust which section of the map is shown on the screen. Hover over the map and use the scroll wheel on your mouse to zoom in and out.
In the same way that selecting a chart or data section adjusts the information shown in all charts and graphs, selecting an area on a map adjusts all chart information. To do this, select the icon in to top right corner of the map. Your cursor will change to a cross that you can use to draw a square on the map.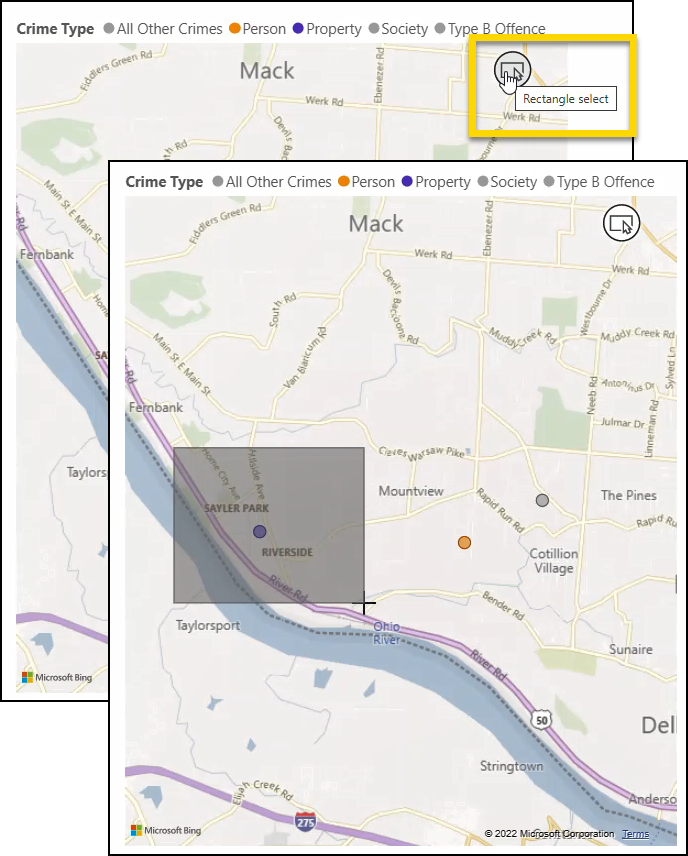
Export dashboards
To export an Analytics dashboard:
- Open the dashboard.
- Use the filters to set which data to include in the export.
- Select Actions > Export dashboard.
- Select a format for the export:
- CSV: A separate CSV file is exported for each table/matrix in the dashboard.
- PDF: Each dashboard tab exports to a separate page in the PDF.
- PPTX: Each dashboard tab exports to a separate slide in the Power Point file.
- Use the checkboxes to select which tabs or tables/matrices to include in the export.
- Select Export dashboard.