Early Intervention System (EIS)
The Early Intervention System (EIS) module, accessed by selecting the alert icon in the main navigation menu, is an early intervention tool that allows agencies to meet CALEA Standard 35.1.9 and to monitor their officers' risk profiles with minimal manual effort.
The EIS collects data from Axon Standards reports and aggregates a count of each type of event each officer is involved in (use of force, traffic collisions, citizen complaints, custom agency forms, etc.).
The EIS administration tools let administrators create policies that outline an acceptable threshold for each type of event (i.e., how many times an officer can be involved in each type of event). When officers cross a threshold, their supervisors are alerted via email. This information is also presented in the EI Dashboard.
Using the EIS module, supervisors can track their actions and counseling in response to alerts.
The EIS module can be accessed from Axon Standards by users with specific privileges. Selecting the alarm icon in the left navigation menu will open the module. Depending on your privileges you will see one or more of the following links:
- My Alert inbox
- Agency Alert inbox
- EI Dashboard
Watch this video for an overview of the Early Intervention System in Axon Standards.
Alerts and reports
EIS alerts are generated based on the report creation date, as well as the officer name and role (Involved) that are entered in the report.
An officer's involvement in an event isn't tracked to an EIS policy until the report is submitted for review. This prevents unnecessary alerts of officers being added to a report by mistake during report drafting.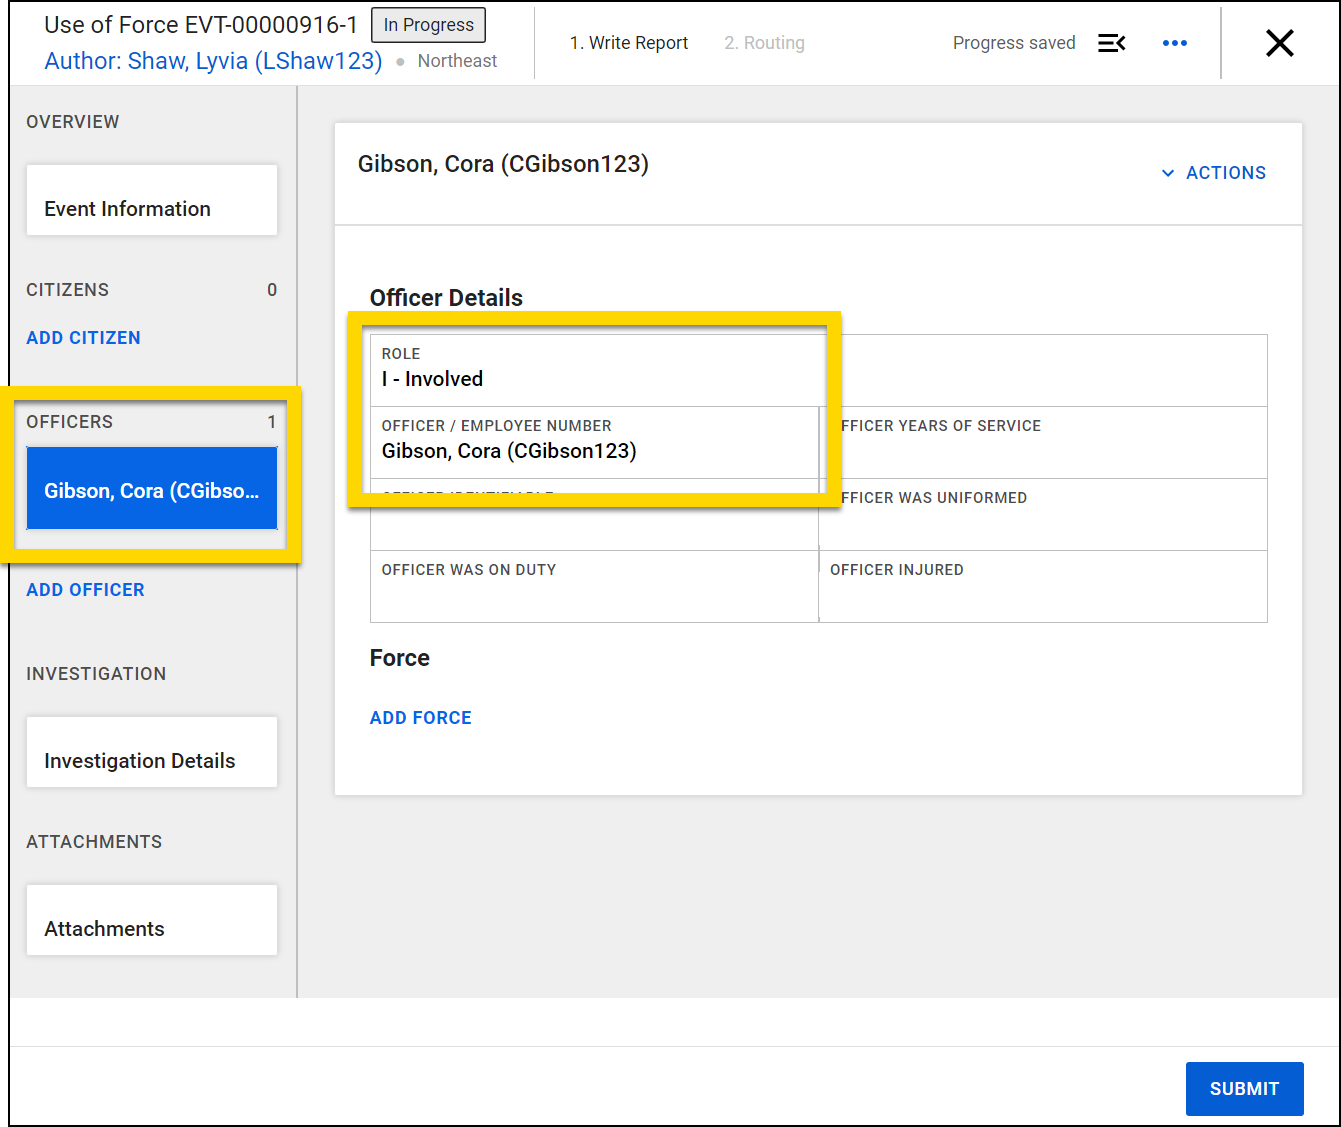
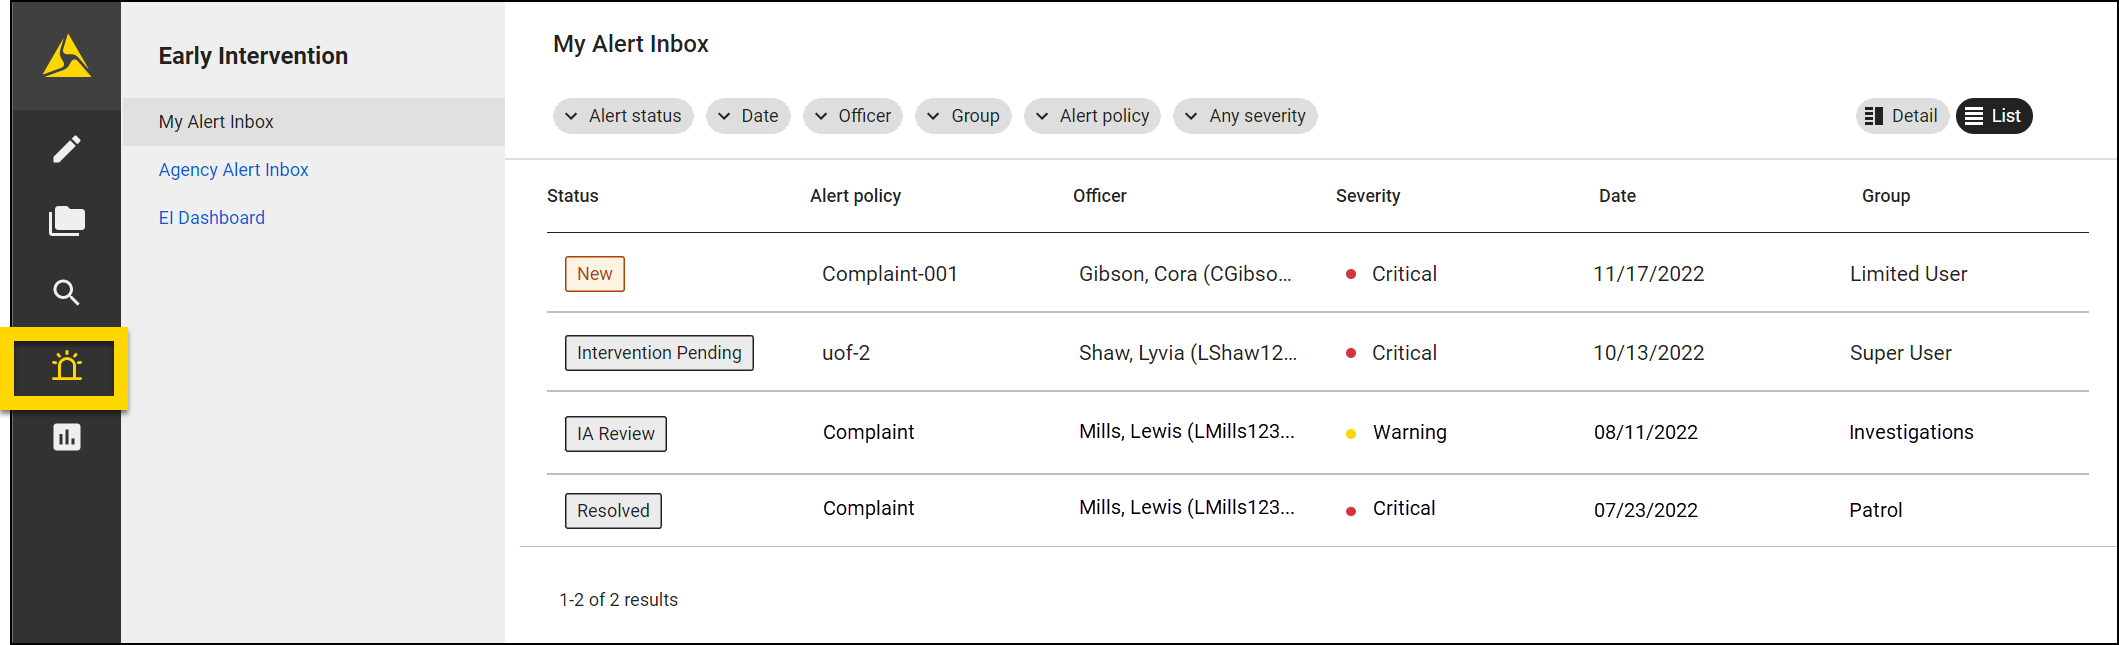
Alert inboxes
The My Alert inbox in the EIS module contains all alerts that have been assigned to you for review (similar to how your My Tasks inbox shows all reports assigned to you). Command staff and IA can use the Agency Alert inbox to see all alerts at the agency.
The following information is included for each alert:
- Status of the alert (New, IA Review, Review, Chain of Command Review, Secondary Review, Intervention Pending, Resolved, False Positive, Acknowledged)
- Alert policy name
- Officer associated with the alert
- Severity of the alert (critical or warning)
- Date of the original alert
- Command Hierarchy group or team the officer belongs to
Use the filters to adjust which tasks are displayed:
- Alert status (New, IA Review, Review, Chain of Command Review, Secondary Review, Intervention Pending, Resolved, False Positive, Acknowledged)
- Date
- Officer
- Group
- Alert policy
- Severity (Critical, Warning, Any severity)
Select an alert to view the alert details.
Alert management
Selecting an alert from either EIS inbox condenses the alert list and opens the Alert Details beside it. To view this page as a full screen, select the full-screen icon. The alert will open in a new browser tab where you can view all information about the alert and take action. Select List to close the Alert Details window and continue browsing the alert list.
From the Alert Details page you can:
- View the alert summary
- Assign the alert for review
- Edit the alert status
- Manage the activity log
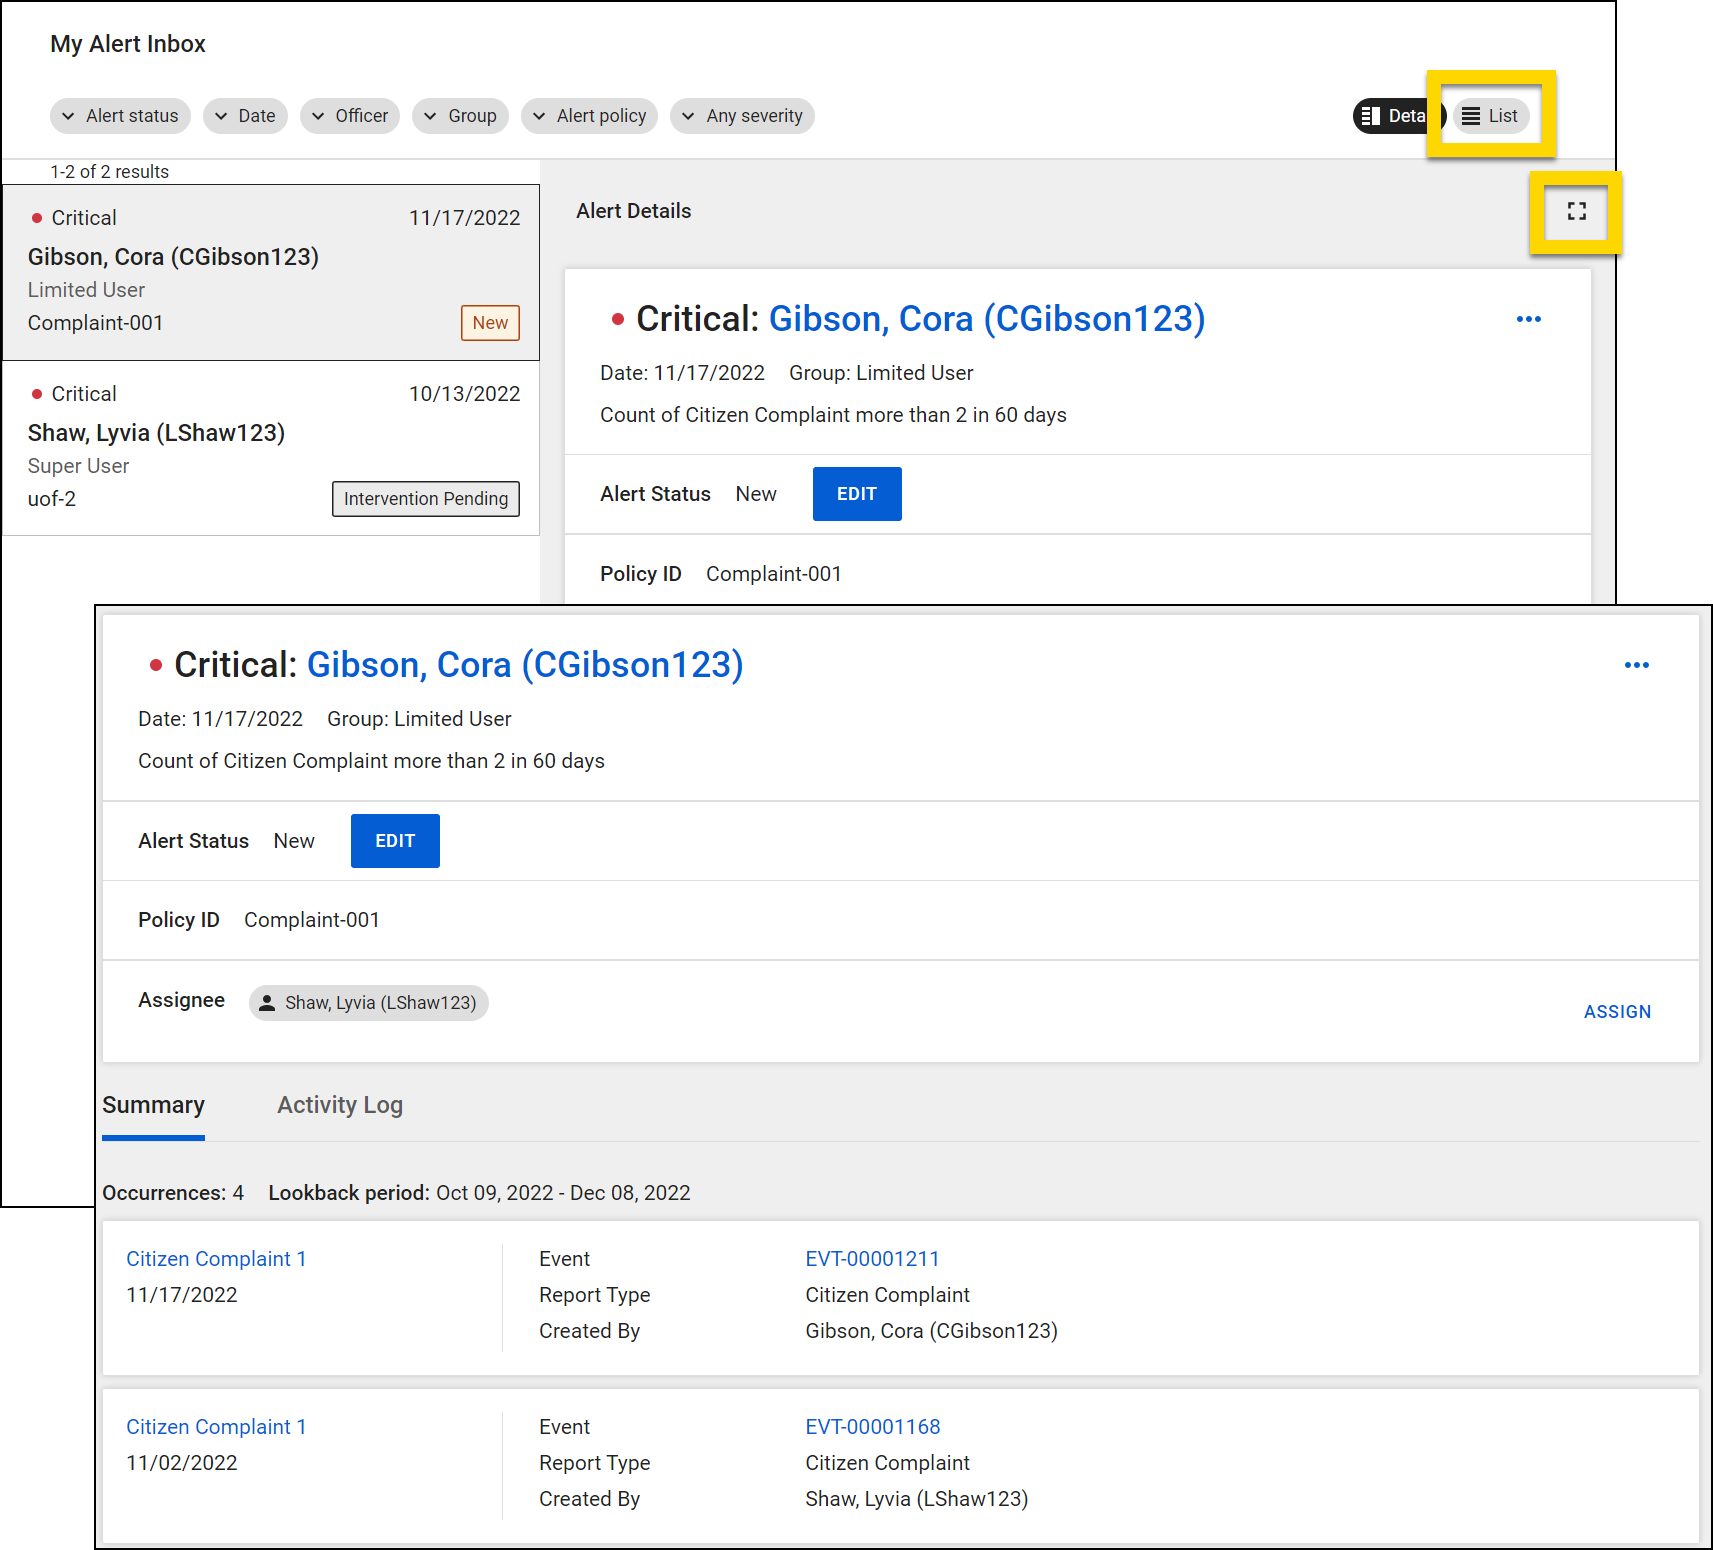
View alert summary
View the events associated with an alert on the Summary tab. Select the report name to open the report in a new browser tab. Select the Event ID to open the event profile in a new browser tab.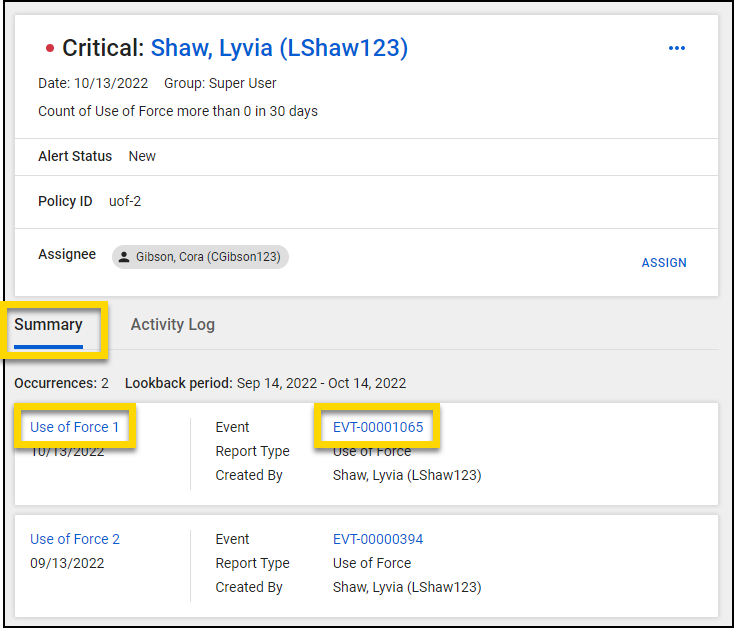
Assign alert
Select Assign to assign a user to review an EIS alert and its associated events.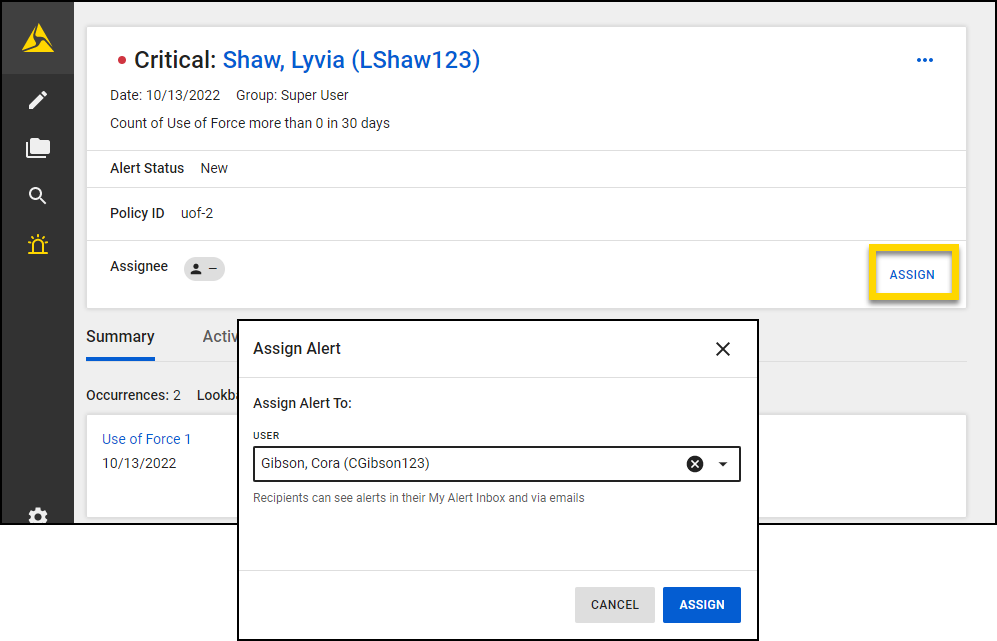
Once assigned to an alert, that user will receive an email notifying them that they have an alert to review.
Edit alert status
If you have been assigned to review an EIS alert, you can select Edit to update the alert status. You can select from the following status options:
Active
- IA Review
- Review (supervisor review)
- Chain of Command Review
- Secondary Review
- Intervention Pending
Closed
- Resolved (the alert has been addressed with the appropriate interventions)
- False Positive (the alert incorrectly indicated that an intervention is needed)
- Acknowledged (after reviewing, the supervisor decides that no action is necessary)
Contact your Axon representative if you would like to customize these statuses to better fit your organization's needs.
Check the Add note checkbox to document additional information about the status update. All status updates will reflect in the alert activity log.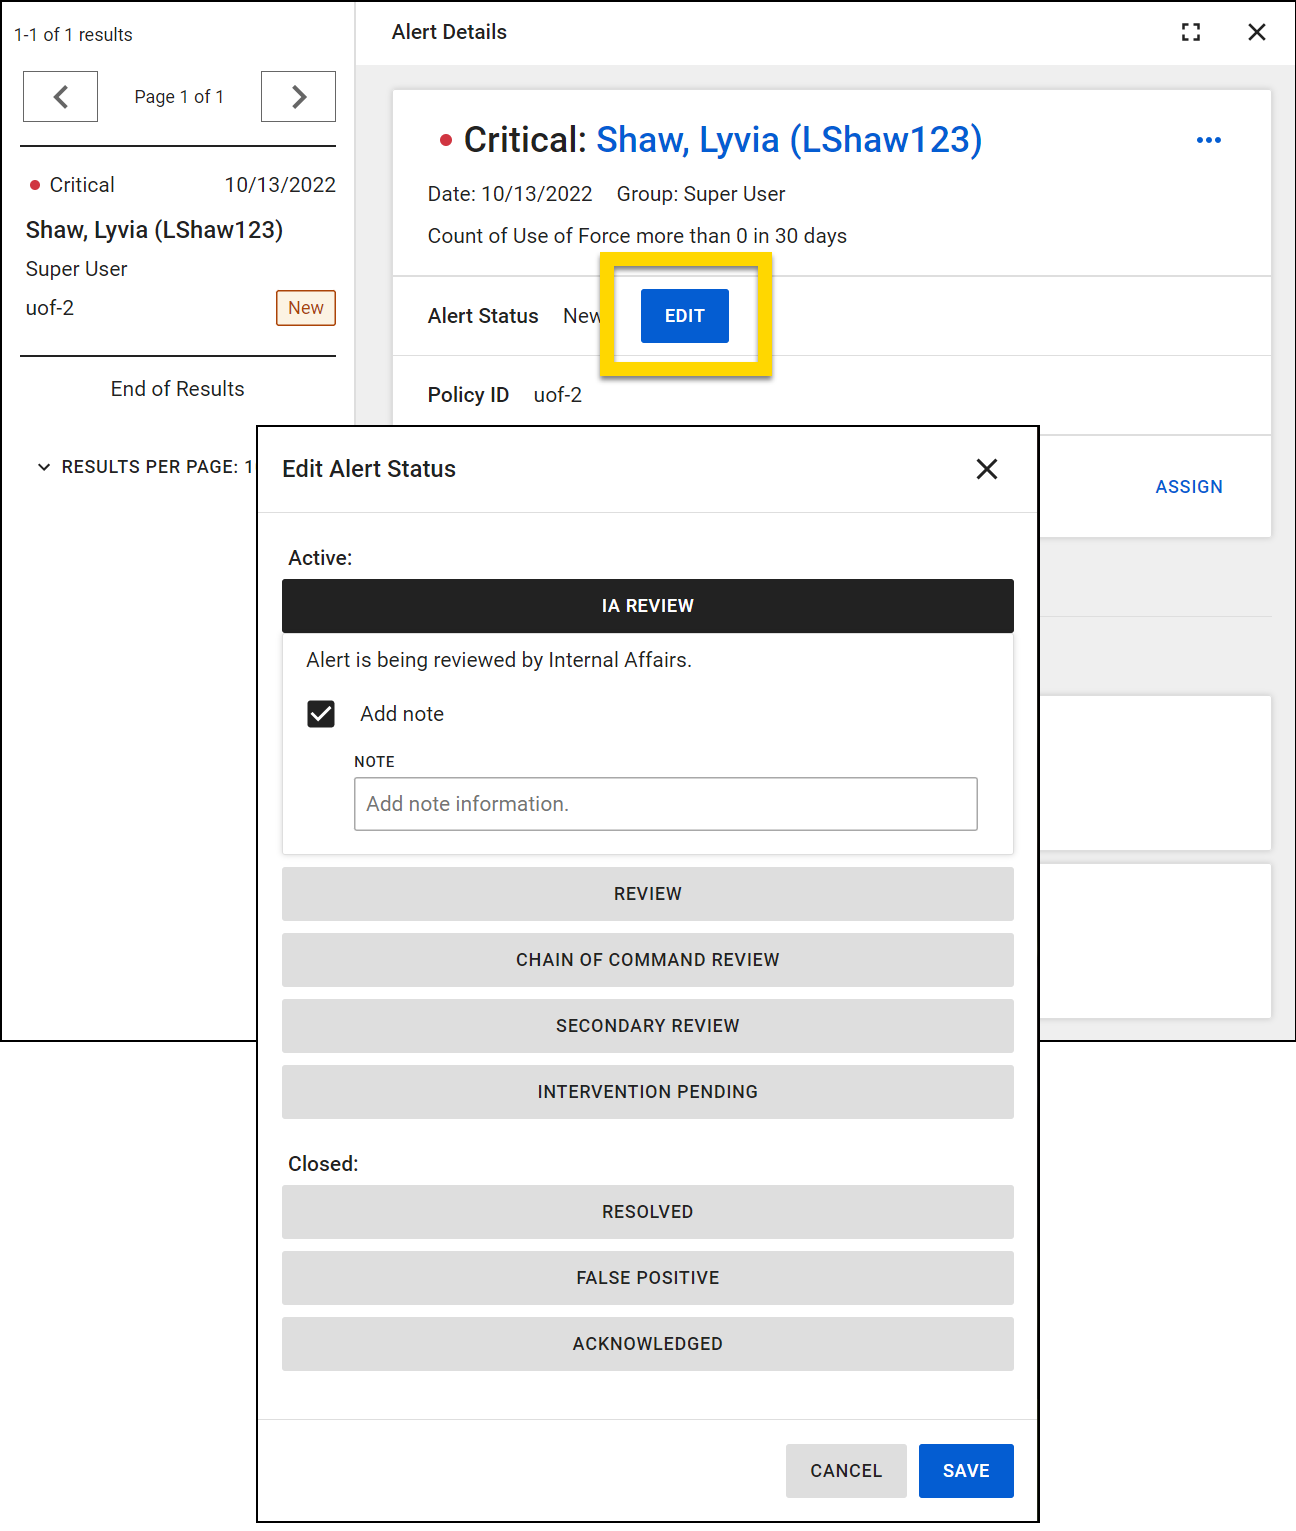
Manage the activity log
Open the Activity Log to view all activities for that alert. Select Add Activity to add an activity to the log. You can include a note or describe an action that was taken.
These notes, along with notes made during status updates can be viewed at any time, even after the alert is resolved, by going to the Agency Alert inbox and filtering to show Resolved alerts.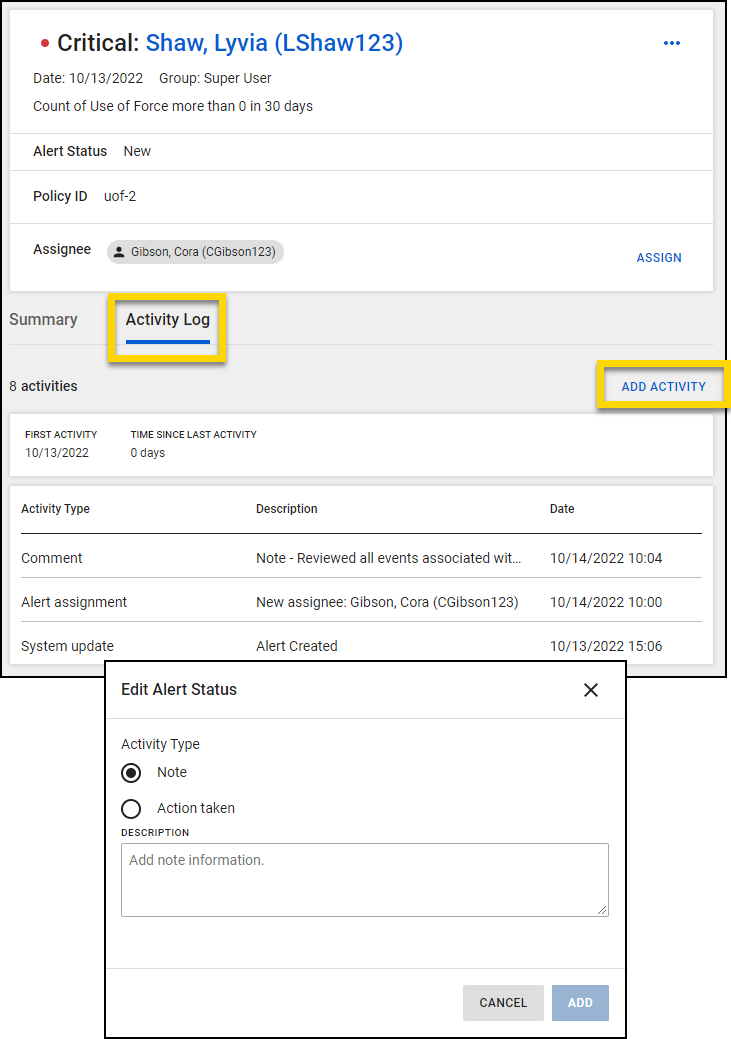
Early Intervention (EI) Dashboard
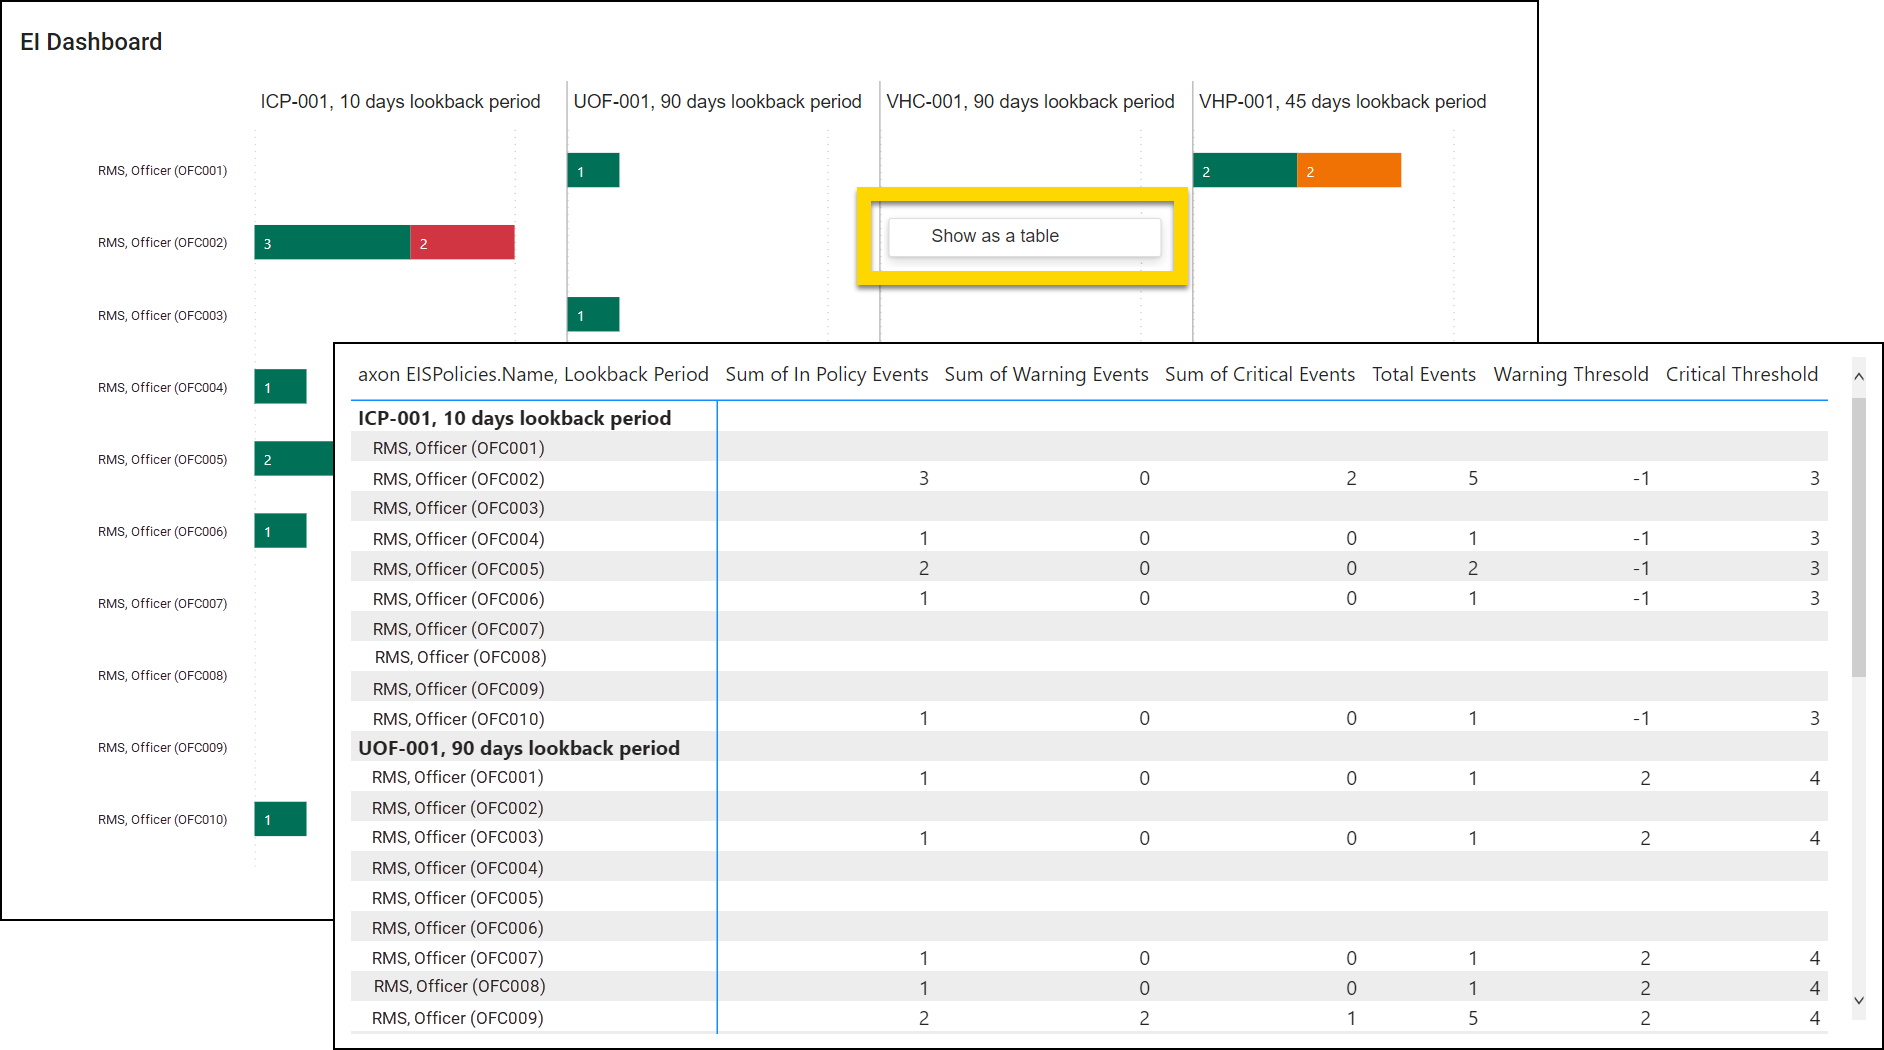
The Early Intervention (EI) Dashboard gives supervisors, command staff, and IA an at-a-glance view of officer performance against policies. The dashboard provides additional data to proactive supervisors who want to identify which officers are in danger of triggering alerts and agency leadership as they evaluate department performance against goals.
The EI Dashboard is organized in a table format. Each row is dedicated to a single officer. Each column indicates a specific policy and lookback period. The lookback period starts on the current day and looks back in time for the rolling timeframe specified by the policy.
If an officer is involved in events tracked by a policy, one or more color bars will appear in their row:
- Green, In Policy Events: The number of events the officer was involved in were below the threshold and an alert didn't trigger for that policy
- Orange, Warning Events: The number of events the officer was involved in triggered a warning alert for that policy.
- Red, Critical Events: The number of events the officer was involved in triggered a critical alert for that policy.
If a user is not associated with any events tracked by a policy, they will not appear in the EI Dashboard. You can control which data each user sees with privileges.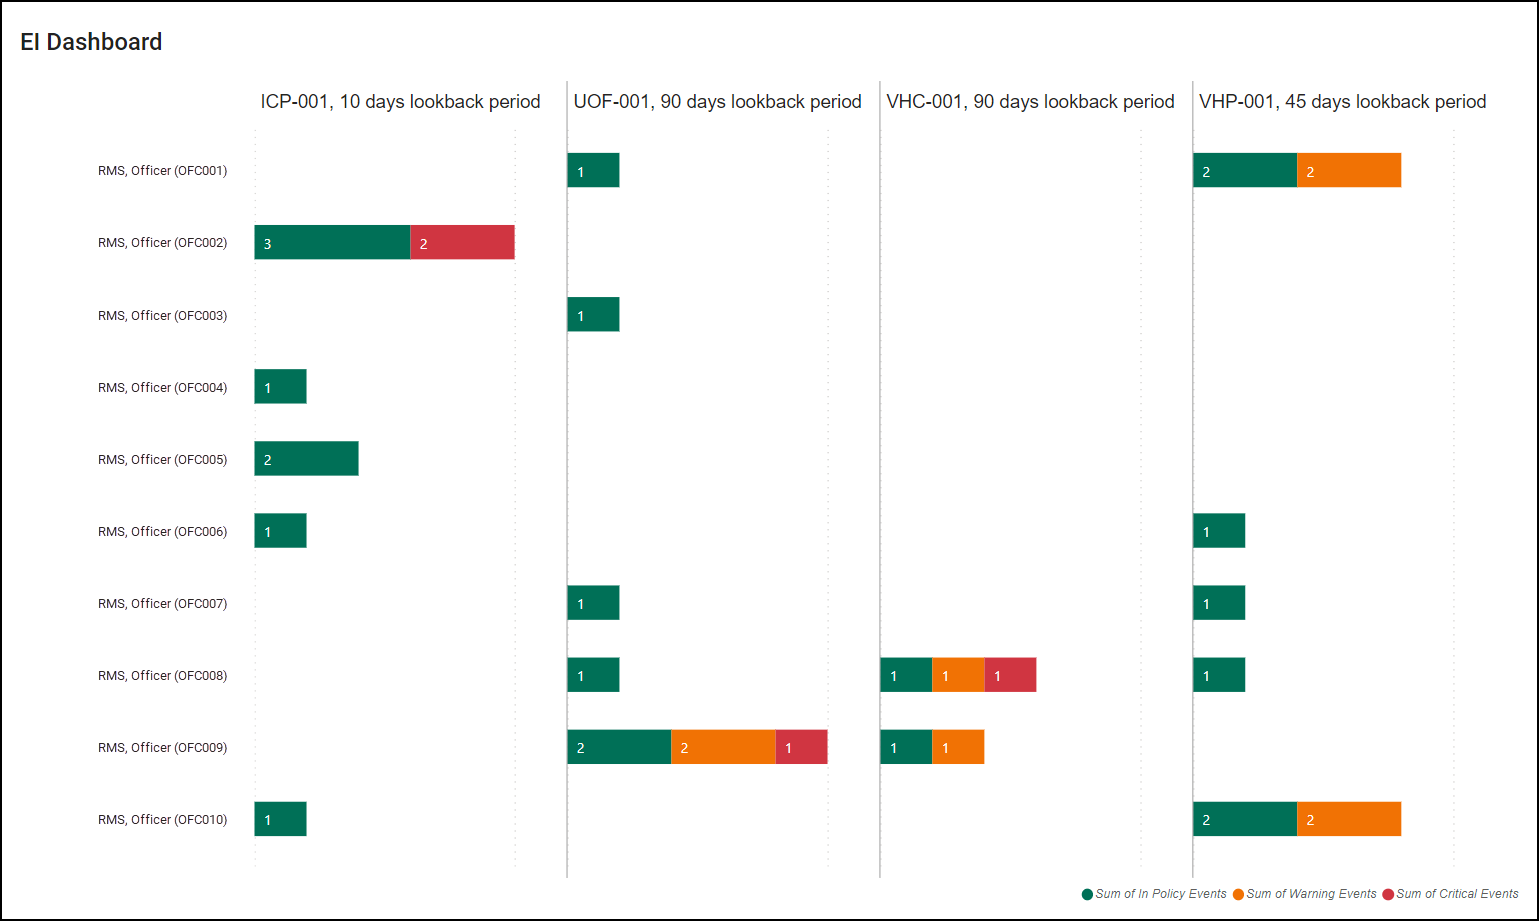
The EI Dashboard shown in this section is an example. The look and feel of this dashboard may vary by organization.
Hovering over any bar reveals all information about that data point.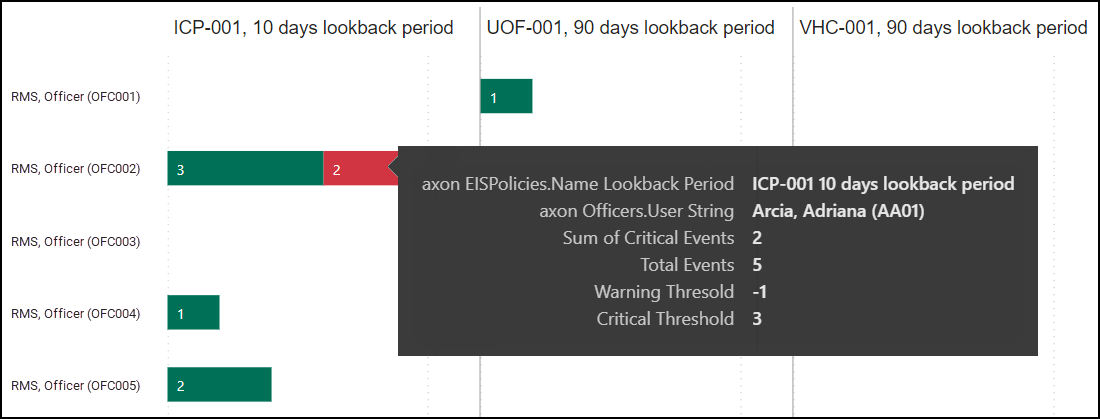
Filters
Use the filters on the right to adjust the information displayed on the screen. You can select from:
- EIS Policy Name
- Lookback Period
- User ID
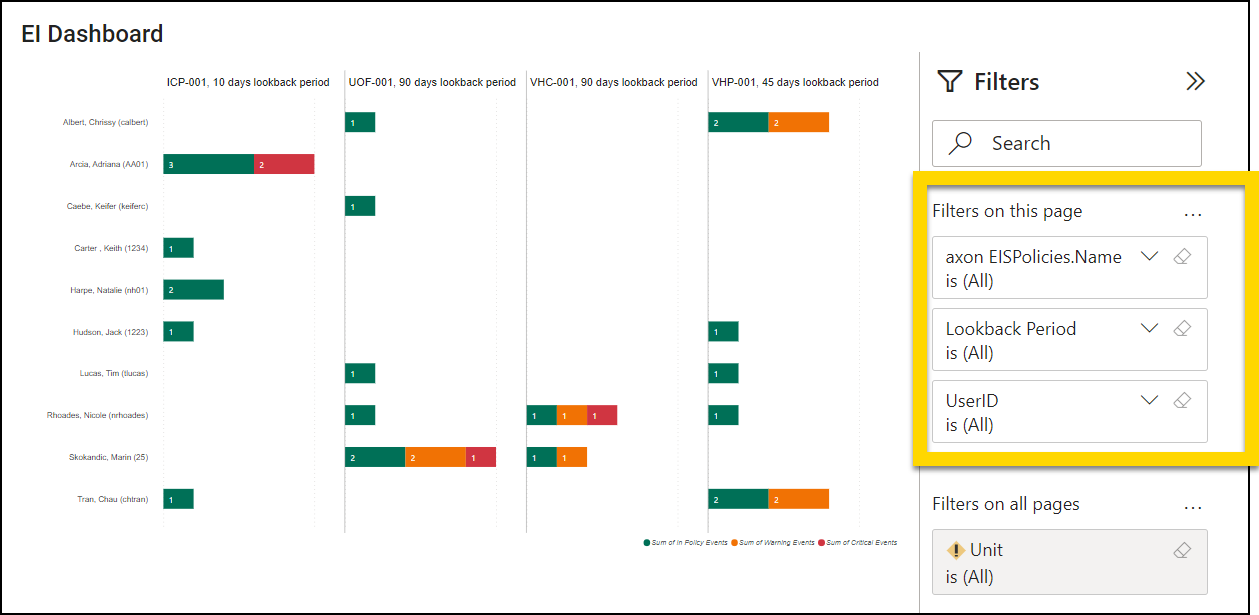
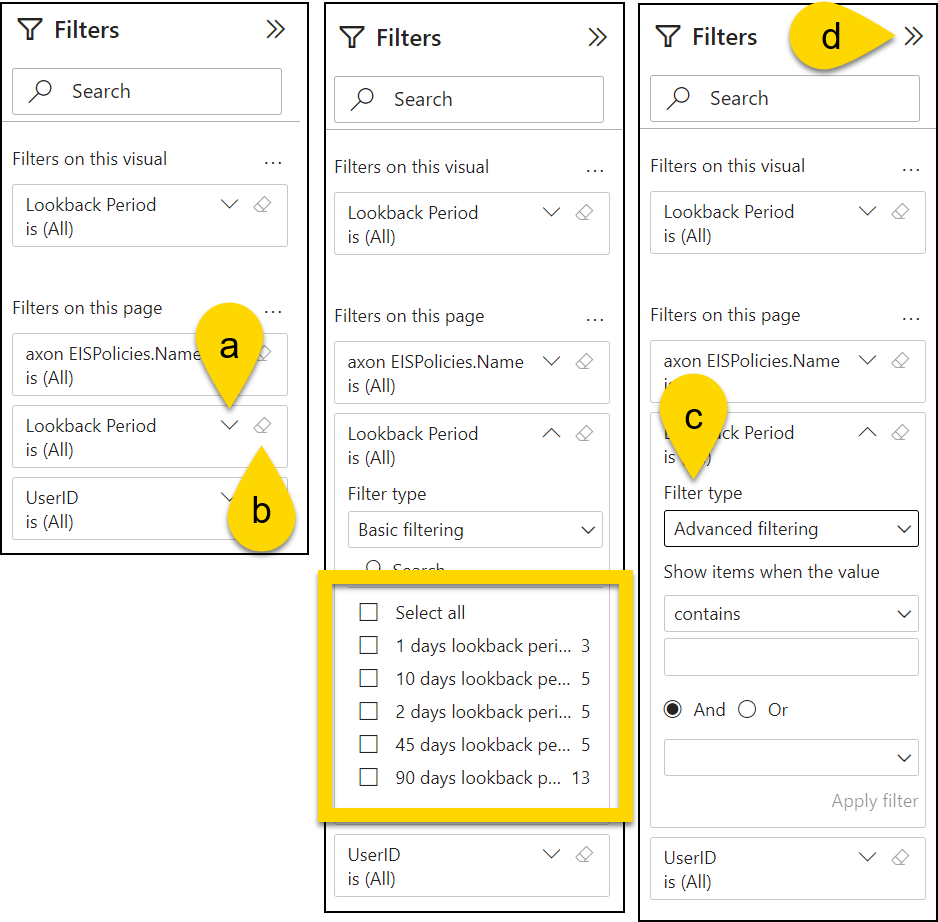
To use the filters:
- Select the arrow beside a filter to reveal a search bar and checkboxes beside specific filters.
- Select the eraser icon to remove any set filters.
- Use the Filter Type menu to switch to advanced filtering where you can narrow down the filter with even more granularity.
- Collapse and expand the filters panel using the sideways arrows.
Show as table
To view the information in a table, right-click anywhere on the chart and select Show as a table. The table will appear below the chart.